Immigrants from Romania vs Immigrants from Belize Associate's Degree
COMPARE
Immigrants from Romania
Immigrants from Belize
Associate's Degree
Associate's Degree Comparison
Immigrants from Romania
Immigrants from Belize
50.9%
ASSOCIATE'S DEGREE
99.5/ 100
METRIC RATING
71st/ 347
METRIC RANK
39.9%
ASSOCIATE'S DEGREE
0.1/ 100
METRIC RATING
285th/ 347
METRIC RANK
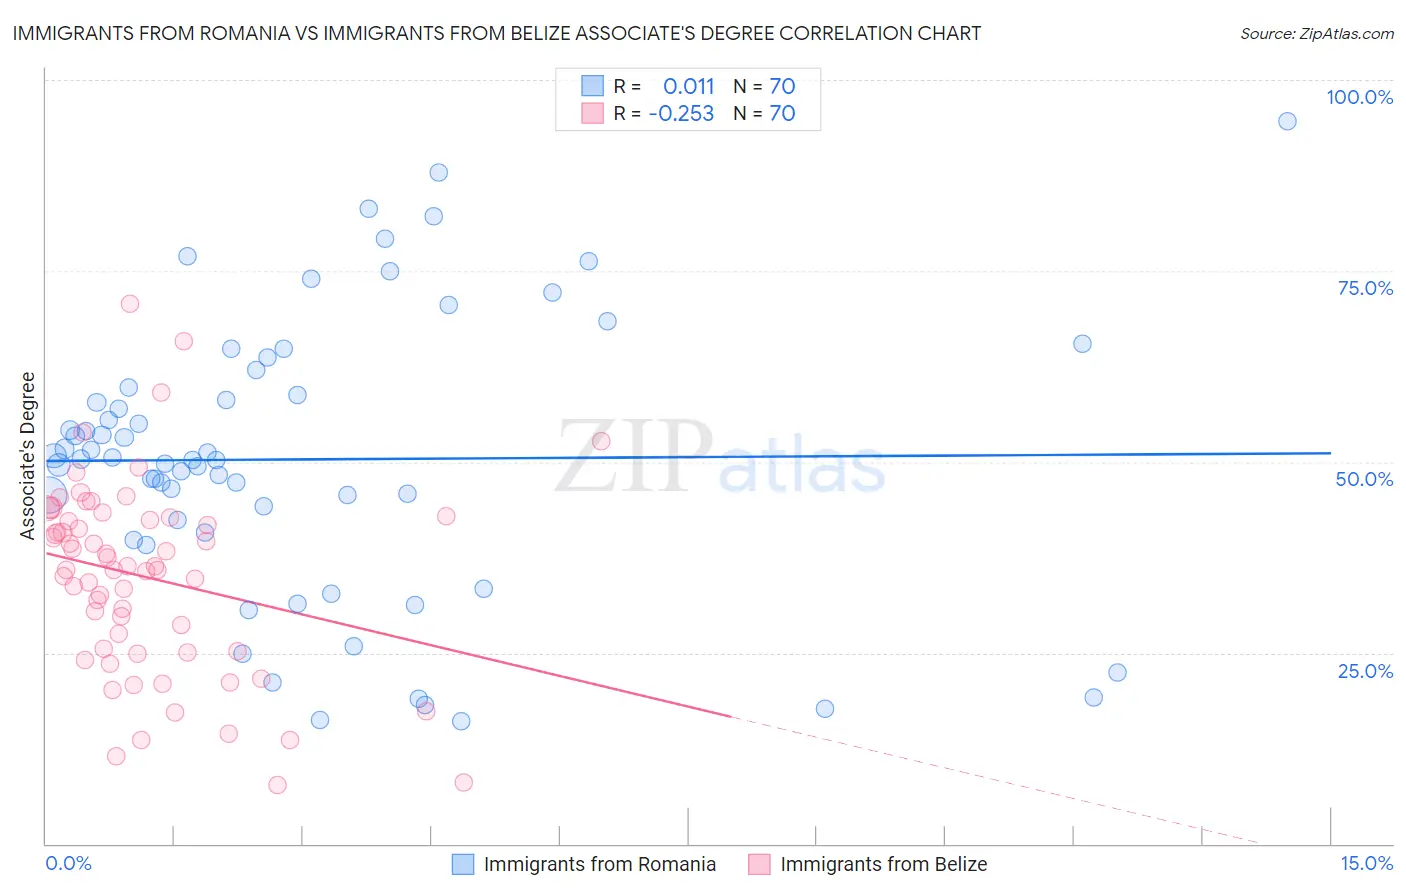
Immigrants from Romania vs Immigrants from Belize Associate's Degree Correlation Chart
The statistical analysis conducted on geographies consisting of 257,014,107 people shows no correlation between the proportion of Immigrants from Romania and percentage of population with at least associate's degree education in the United States with a correlation coefficient (R) of 0.011 and weighted average of 50.9%. Similarly, the statistical analysis conducted on geographies consisting of 130,322,630 people shows a weak negative correlation between the proportion of Immigrants from Belize and percentage of population with at least associate's degree education in the United States with a correlation coefficient (R) of -0.253 and weighted average of 39.9%, a difference of 27.7%.
Associate's Degree Correlation Summary
| Measurement | Immigrants from Romania | Immigrants from Belize |
| Minimum | 16.1% | 7.7% |
| Maximum | 94.5% | 70.8% |
| Range | 78.4% | 63.1% |
| Mean | 50.3% | 34.9% |
| Median | 50.3% | 36.1% |
| Interquartile 25% (IQ1) | 40.7% | 25.1% |
| Interquartile 75% (IQ3) | 59.7% | 42.6% |
| Interquartile Range (IQR) | 19.1% | 17.5% |
| Standard Deviation (Sample) | 18.2% | 12.7% |
| Standard Deviation (Population) | 18.1% | 12.6% |
Similar Demographics by Associate's Degree
Demographics Similar to Immigrants from Romania by Associate's Degree
In terms of associate's degree, the demographic groups most similar to Immigrants from Romania are Immigrants from Argentina (50.9%, a difference of 0.010%), Egyptian (50.9%, a difference of 0.040%), Immigrants from Pakistan (50.9%, a difference of 0.060%), Immigrants from Indonesia (51.0%, a difference of 0.16%), and Carpatho Rusyn (50.6%, a difference of 0.53%).
| Demographics | Rating | Rank | Associate's Degree |
| Immigrants | Netherlands | 99.7 /100 | #64 | Exceptional 51.4% |
| Zimbabweans | 99.7 /100 | #65 | Exceptional 51.3% |
| Immigrants | Europe | 99.7 /100 | #66 | Exceptional 51.3% |
| Argentineans | 99.6 /100 | #67 | Exceptional 51.2% |
| Immigrants | Indonesia | 99.5 /100 | #68 | Exceptional 51.0% |
| Egyptians | 99.5 /100 | #69 | Exceptional 50.9% |
| Immigrants | Argentina | 99.5 /100 | #70 | Exceptional 50.9% |
| Immigrants | Romania | 99.5 /100 | #71 | Exceptional 50.9% |
| Immigrants | Pakistan | 99.5 /100 | #72 | Exceptional 50.9% |
| Carpatho Rusyns | 99.3 /100 | #73 | Exceptional 50.6% |
| Lithuanians | 99.3 /100 | #74 | Exceptional 50.6% |
| Immigrants | Scotland | 99.3 /100 | #75 | Exceptional 50.6% |
| Immigrants | Zimbabwe | 99.2 /100 | #76 | Exceptional 50.5% |
| Immigrants | Lebanon | 99.1 /100 | #77 | Exceptional 50.5% |
| Immigrants | Eastern Europe | 99.1 /100 | #78 | Exceptional 50.5% |
Demographics Similar to Immigrants from Belize by Associate's Degree
In terms of associate's degree, the demographic groups most similar to Immigrants from Belize are Comanche (39.9%, a difference of 0.10%), Haitian (40.0%, a difference of 0.21%), Immigrants from Caribbean (39.7%, a difference of 0.34%), Bangladeshi (40.0%, a difference of 0.36%), and Aleut (39.6%, a difference of 0.60%).
| Demographics | Rating | Rank | Associate's Degree |
| Ottawa | 0.1 /100 | #278 | Tragic 40.3% |
| Immigrants | Nicaragua | 0.1 /100 | #279 | Tragic 40.3% |
| Immigrants | Micronesia | 0.1 /100 | #280 | Tragic 40.2% |
| Immigrants | Portugal | 0.1 /100 | #281 | Tragic 40.1% |
| Bangladeshis | 0.1 /100 | #282 | Tragic 40.0% |
| Haitians | 0.1 /100 | #283 | Tragic 40.0% |
| Comanche | 0.1 /100 | #284 | Tragic 39.9% |
| Immigrants | Belize | 0.1 /100 | #285 | Tragic 39.9% |
| Immigrants | Caribbean | 0.0 /100 | #286 | Tragic 39.7% |
| Aleuts | 0.0 /100 | #287 | Tragic 39.6% |
| Immigrants | Cuba | 0.0 /100 | #288 | Tragic 39.5% |
| Central Americans | 0.0 /100 | #289 | Tragic 39.4% |
| Immigrants | Haiti | 0.0 /100 | #290 | Tragic 39.3% |
| Dominicans | 0.0 /100 | #291 | Tragic 39.3% |
| Blacks/African Americans | 0.0 /100 | #292 | Tragic 39.1% |