Sioux vs Immigrants from Belize Associate's Degree
COMPARE
Sioux
Immigrants from Belize
Associate's Degree
Associate's Degree Comparison
Sioux
Immigrants from Belize
38.5%
ASSOCIATE'S DEGREE
0.0/ 100
METRIC RATING
304th/ 347
METRIC RANK
39.9%
ASSOCIATE'S DEGREE
0.1/ 100
METRIC RATING
285th/ 347
METRIC RANK
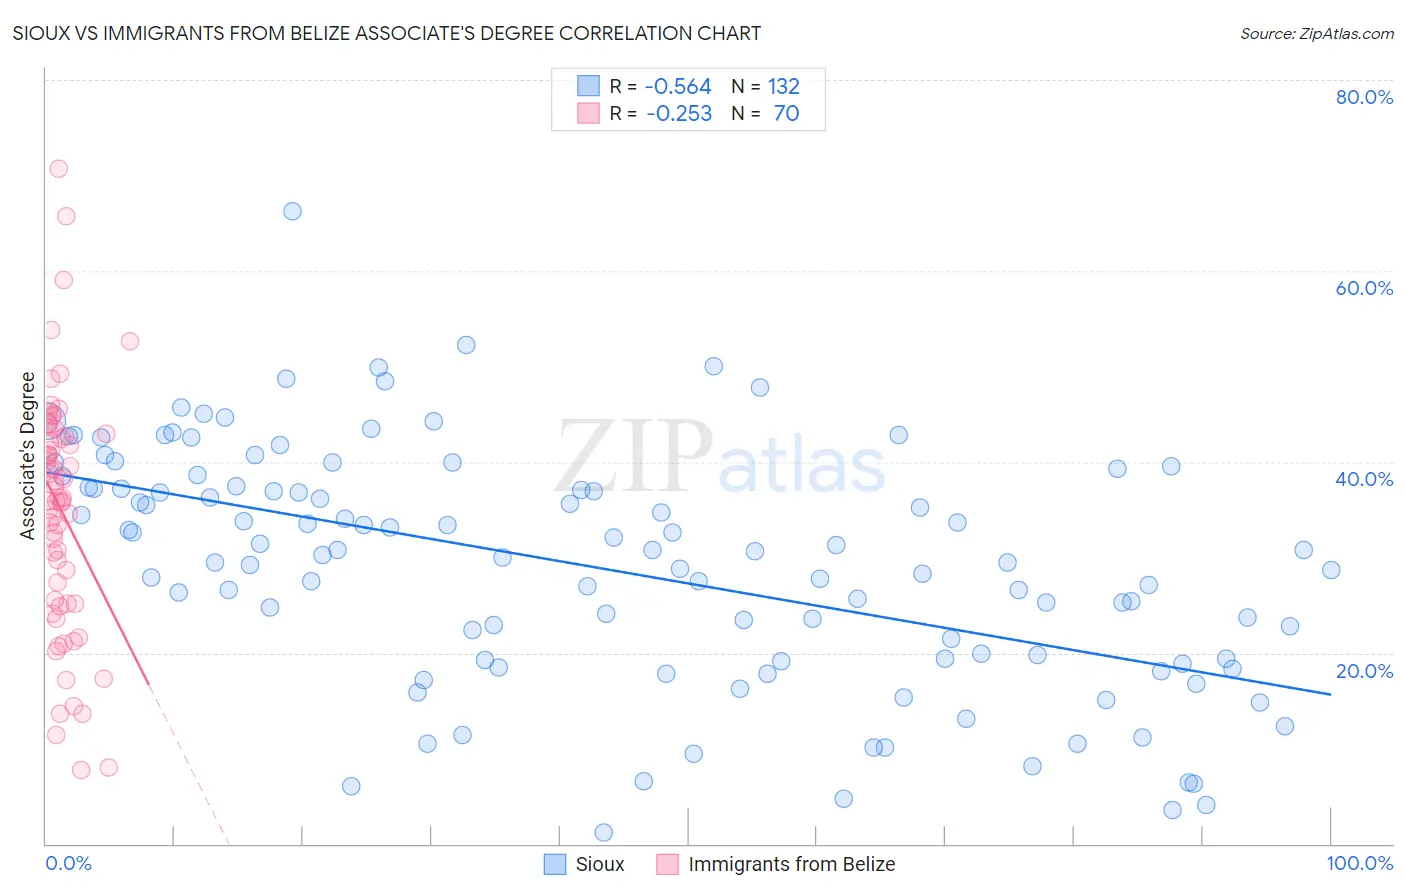
Sioux vs Immigrants from Belize Associate's Degree Correlation Chart
The statistical analysis conducted on geographies consisting of 234,195,358 people shows a substantial negative correlation between the proportion of Sioux and percentage of population with at least associate's degree education in the United States with a correlation coefficient (R) of -0.564 and weighted average of 38.5%. Similarly, the statistical analysis conducted on geographies consisting of 130,322,630 people shows a weak negative correlation between the proportion of Immigrants from Belize and percentage of population with at least associate's degree education in the United States with a correlation coefficient (R) of -0.253 and weighted average of 39.9%, a difference of 3.6%.
Associate's Degree Correlation Summary
| Measurement | Sioux | Immigrants from Belize |
| Minimum | 1.2% | 7.7% |
| Maximum | 66.3% | 70.8% |
| Range | 65.1% | 63.1% |
| Mean | 28.9% | 34.9% |
| Median | 30.1% | 36.1% |
| Interquartile 25% (IQ1) | 19.3% | 25.1% |
| Interquartile 75% (IQ3) | 37.3% | 42.6% |
| Interquartile Range (IQR) | 18.0% | 17.5% |
| Standard Deviation (Sample) | 12.4% | 12.7% |
| Standard Deviation (Population) | 12.3% | 12.6% |
Demographics Similar to Sioux and Immigrants from Belize by Associate's Degree
In terms of associate's degree, the demographic groups most similar to Sioux are Guatemalan (38.5%, a difference of 0.050%), Colville (38.5%, a difference of 0.14%), Tsimshian (38.6%, a difference of 0.29%), Chickasaw (38.6%, a difference of 0.34%), and Ute (38.6%, a difference of 0.38%). Similarly, the demographic groups most similar to Immigrants from Belize are Comanche (39.9%, a difference of 0.10%), Immigrants from Caribbean (39.7%, a difference of 0.34%), Aleut (39.6%, a difference of 0.60%), Immigrants from Cuba (39.5%, a difference of 0.84%), and Central American (39.4%, a difference of 1.1%).
| Demographics | Rating | Rank | Associate's Degree |
| Comanche | 0.1 /100 | #284 | Tragic 39.9% |
| Immigrants | Belize | 0.1 /100 | #285 | Tragic 39.9% |
| Immigrants | Caribbean | 0.0 /100 | #286 | Tragic 39.7% |
| Aleuts | 0.0 /100 | #287 | Tragic 39.6% |
| Immigrants | Cuba | 0.0 /100 | #288 | Tragic 39.5% |
| Central Americans | 0.0 /100 | #289 | Tragic 39.4% |
| Immigrants | Haiti | 0.0 /100 | #290 | Tragic 39.3% |
| Dominicans | 0.0 /100 | #291 | Tragic 39.3% |
| Blacks/African Americans | 0.0 /100 | #292 | Tragic 39.1% |
| Nepalese | 0.0 /100 | #293 | Tragic 39.0% |
| Salvadorans | 0.0 /100 | #294 | Tragic 39.0% |
| Hondurans | 0.0 /100 | #295 | Tragic 38.9% |
| Cherokee | 0.0 /100 | #296 | Tragic 38.9% |
| Cape Verdeans | 0.0 /100 | #297 | Tragic 38.8% |
| Cheyenne | 0.0 /100 | #298 | Tragic 38.7% |
| Ute | 0.0 /100 | #299 | Tragic 38.6% |
| Chickasaw | 0.0 /100 | #300 | Tragic 38.6% |
| Tsimshian | 0.0 /100 | #301 | Tragic 38.6% |
| Colville | 0.0 /100 | #302 | Tragic 38.5% |
| Guatemalans | 0.0 /100 | #303 | Tragic 38.5% |
| Sioux | 0.0 /100 | #304 | Tragic 38.5% |