Asian vs Immigrants from Belize Average Family Size
COMPARE
Asian
Immigrants from Belize
Average Family Size
Average Family Size Comparison
Asians
Immigrants from Belize
3.28
AVERAGE FAMILY SIZE
97.0/ 100
METRIC RATING
108th/ 347
METRIC RANK
3.39
AVERAGE FAMILY SIZE
100.0/ 100
METRIC RATING
38th/ 347
METRIC RANK
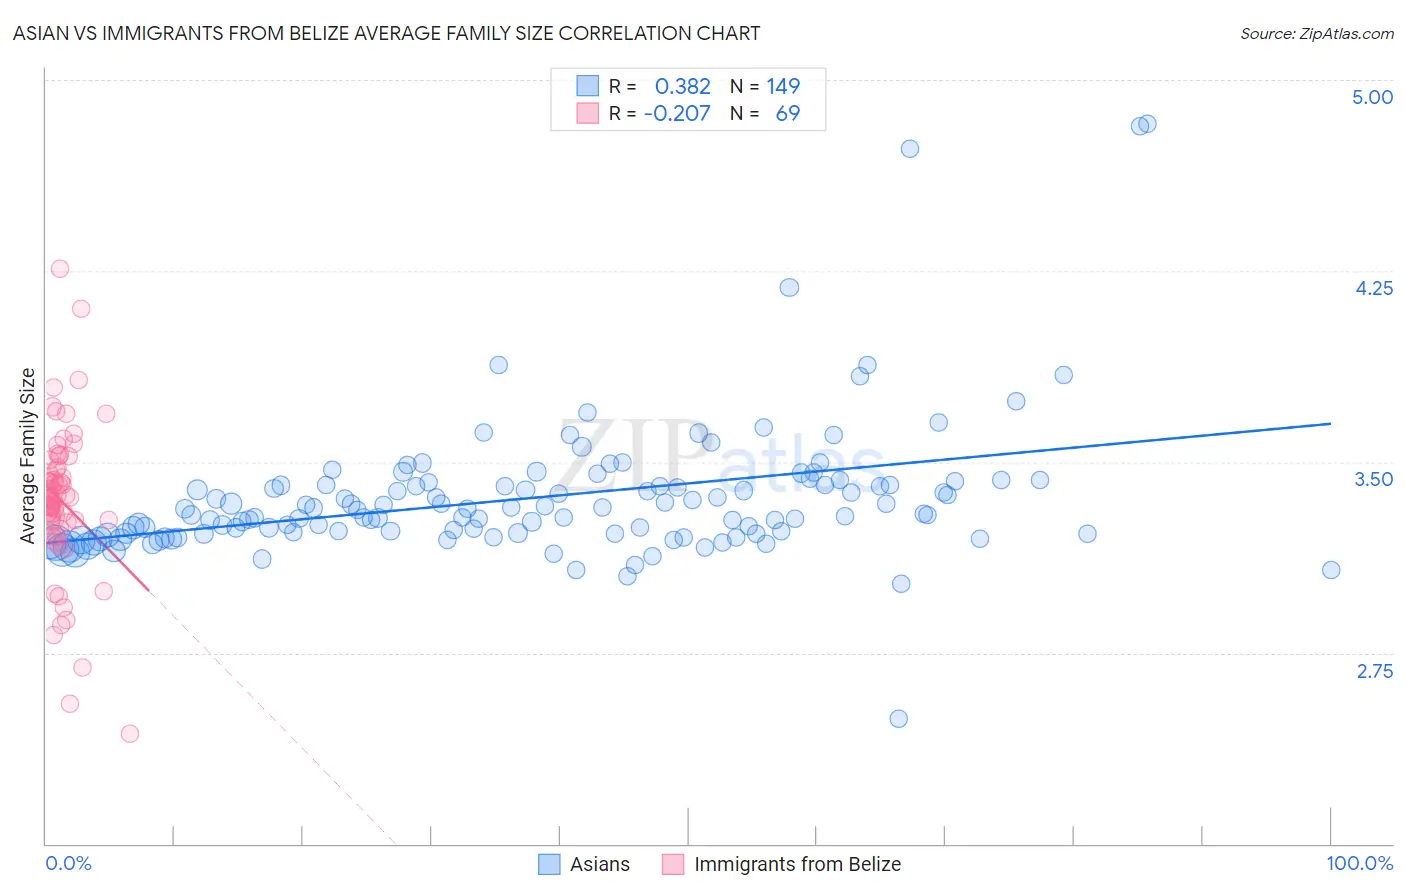
Asian vs Immigrants from Belize Average Family Size Correlation Chart
The statistical analysis conducted on geographies consisting of 550,276,213 people shows a mild positive correlation between the proportion of Asians and average family size in the United States with a correlation coefficient (R) of 0.382 and weighted average of 3.28. Similarly, the statistical analysis conducted on geographies consisting of 130,207,410 people shows a weak negative correlation between the proportion of Immigrants from Belize and average family size in the United States with a correlation coefficient (R) of -0.207 and weighted average of 3.39, a difference of 3.5%.
Average Family Size Correlation Summary
| Measurement | Asian | Immigrants from Belize |
| Minimum | 2.49 | 2.43 |
| Maximum | 4.83 | 4.26 |
| Range | 2.34 | 1.83 |
| Mean | 3.36 | 3.35 |
| Median | 3.29 | 3.37 |
| Interquartile 25% (IQ1) | 3.22 | 3.26 |
| Interquartile 75% (IQ3) | 3.41 | 3.49 |
| Interquartile Range (IQR) | 0.19 | 0.23 |
| Standard Deviation (Sample) | 0.28 | 0.30 |
| Standard Deviation (Population) | 0.28 | 0.30 |
Similar Demographics by Average Family Size
Demographics Similar to Asians by Average Family Size
In terms of average family size, the demographic groups most similar to Asians are Puerto Rican (3.28, a difference of 0.050%), Bahamian (3.28, a difference of 0.060%), Indonesian (3.28, a difference of 0.11%), Ghanaian (3.29, a difference of 0.17%), and Black/African American (3.27, a difference of 0.17%).
| Demographics | Rating | Rank | Average Family Size |
| Immigrants | Burma/Myanmar | 98.6 /100 | #101 | Exceptional 3.29 |
| West Indians | 98.5 /100 | #102 | Exceptional 3.29 |
| Immigrants | Western Africa | 98.4 /100 | #103 | Exceptional 3.29 |
| Bolivians | 98.3 /100 | #104 | Exceptional 3.29 |
| Immigrants | Ghana | 98.1 /100 | #105 | Exceptional 3.29 |
| Paiute | 98.0 /100 | #106 | Exceptional 3.29 |
| Ghanaians | 98.0 /100 | #107 | Exceptional 3.29 |
| Asians | 97.0 /100 | #108 | Exceptional 3.28 |
| Puerto Ricans | 96.7 /100 | #109 | Exceptional 3.28 |
| Bahamians | 96.6 /100 | #110 | Exceptional 3.28 |
| Indonesians | 96.2 /100 | #111 | Exceptional 3.28 |
| Blacks/African Americans | 95.7 /100 | #112 | Exceptional 3.27 |
| Immigrants | Panama | 95.6 /100 | #113 | Exceptional 3.27 |
| South Americans | 95.1 /100 | #114 | Exceptional 3.27 |
| Immigrants | Liberia | 95.0 /100 | #115 | Exceptional 3.27 |
Demographics Similar to Immigrants from Belize by Average Family Size
In terms of average family size, the demographic groups most similar to Immigrants from Belize are Immigrants from Haiti (3.39, a difference of 0.080%), Guyanese (3.40, a difference of 0.16%), Belizean (3.39, a difference of 0.20%), Immigrants from Guyana (3.40, a difference of 0.30%), and Guatemalan (3.40, a difference of 0.35%).
| Demographics | Rating | Rank | Average Family Size |
| Central Americans | 100.0 /100 | #31 | Exceptional 3.41 |
| Immigrants | Guatemala | 100.0 /100 | #32 | Exceptional 3.41 |
| Hawaiians | 100.0 /100 | #33 | Exceptional 3.41 |
| Hispanics or Latinos | 100.0 /100 | #34 | Exceptional 3.41 |
| Guatemalans | 100.0 /100 | #35 | Exceptional 3.40 |
| Immigrants | Guyana | 100.0 /100 | #36 | Exceptional 3.40 |
| Guyanese | 100.0 /100 | #37 | Exceptional 3.40 |
| Immigrants | Belize | 100.0 /100 | #38 | Exceptional 3.39 |
| Immigrants | Haiti | 100.0 /100 | #39 | Exceptional 3.39 |
| Belizeans | 100.0 /100 | #40 | Exceptional 3.39 |
| Marshallese | 100.0 /100 | #41 | Exceptional 3.38 |
| Immigrants | Vietnam | 100.0 /100 | #42 | Exceptional 3.38 |
| Immigrants | Philippines | 100.0 /100 | #43 | Exceptional 3.37 |
| Alaska Natives | 100.0 /100 | #44 | Exceptional 3.37 |
| Shoshone | 100.0 /100 | #45 | Exceptional 3.37 |