Arapaho vs Canadian Bachelor's Degree
COMPARE
Arapaho
Canadian
Bachelor's Degree
Bachelor's Degree Comparison
Arapaho
Canadians
26.6%
BACHELOR'S DEGREE
0.0/ 100
METRIC RATING
334th/ 347
METRIC RANK
38.8%
BACHELOR'S DEGREE
75.0/ 100
METRIC RATING
154th/ 347
METRIC RANK
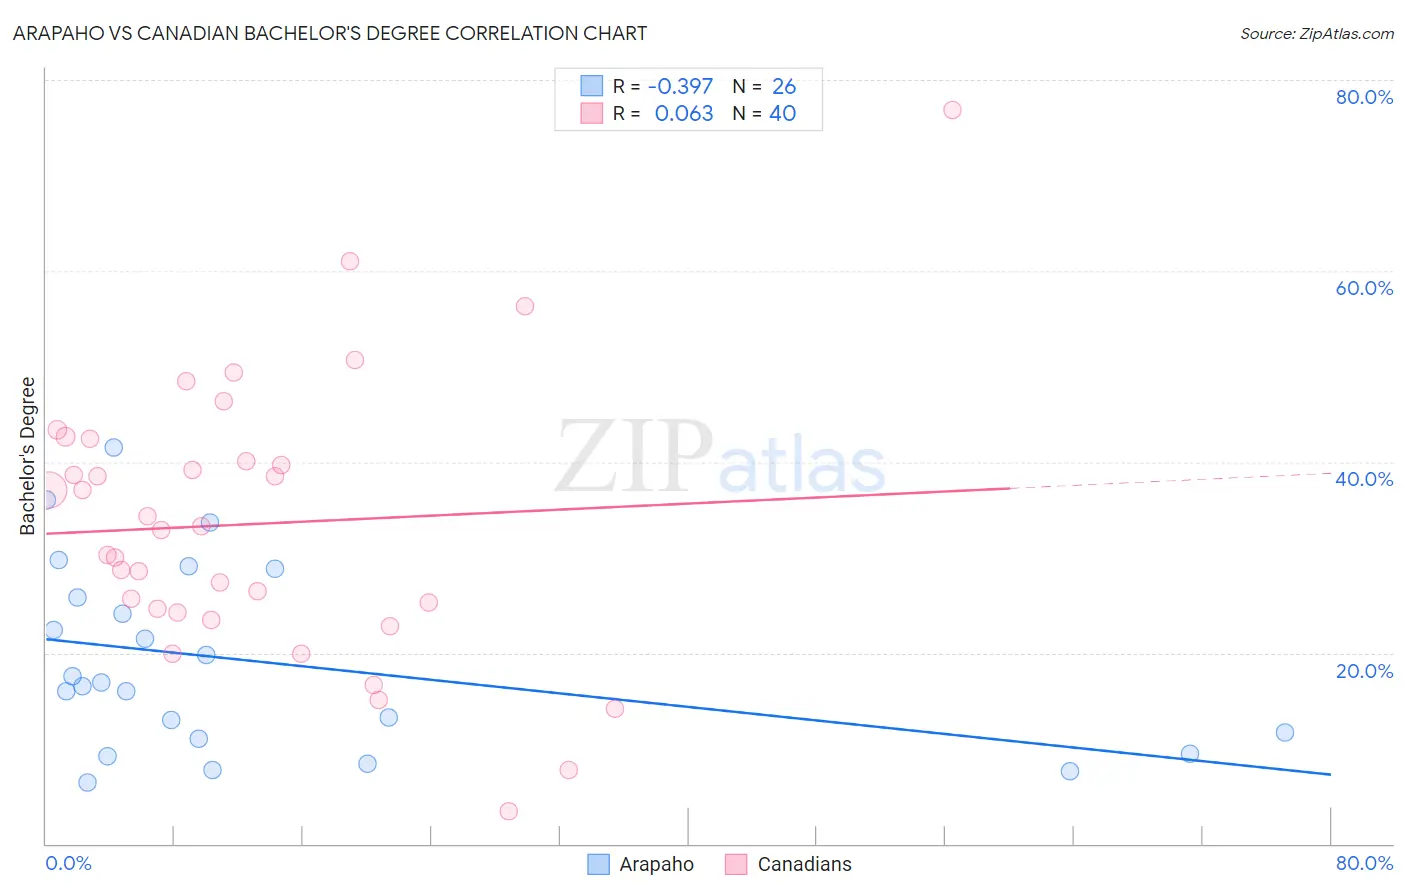
Arapaho vs Canadian Bachelor's Degree Correlation Chart
The statistical analysis conducted on geographies consisting of 29,779,045 people shows a mild negative correlation between the proportion of Arapaho and percentage of population with at least bachelor's degree education in the United States with a correlation coefficient (R) of -0.397 and weighted average of 26.6%. Similarly, the statistical analysis conducted on geographies consisting of 437,524,144 people shows a slight positive correlation between the proportion of Canadians and percentage of population with at least bachelor's degree education in the United States with a correlation coefficient (R) of 0.063 and weighted average of 38.8%, a difference of 45.9%.
Bachelor's Degree Correlation Summary
| Measurement | Arapaho | Canadian |
| Minimum | 6.4% | 3.4% |
| Maximum | 41.6% | 76.9% |
| Range | 35.1% | 73.5% |
| Mean | 18.9% | 33.5% |
| Median | 16.7% | 33.0% |
| Interquartile 25% (IQ1) | 11.0% | 24.5% |
| Interquartile 75% (IQ3) | 25.8% | 41.3% |
| Interquartile Range (IQR) | 14.8% | 16.8% |
| Standard Deviation (Sample) | 9.7% | 14.5% |
| Standard Deviation (Population) | 9.5% | 14.3% |
Similar Demographics by Bachelor's Degree
Demographics Similar to Arapaho by Bachelor's Degree
In terms of bachelor's degree, the demographic groups most similar to Arapaho are Native/Alaskan (26.3%, a difference of 1.1%), Mexican (27.1%, a difference of 1.7%), Immigrants from Mexico (26.1%, a difference of 1.9%), Menominee (27.3%, a difference of 2.5%), and Immigrants from the Azores (27.3%, a difference of 2.6%).
| Demographics | Rating | Rank | Bachelor's Degree |
| Paiute | 0.0 /100 | #327 | Tragic 28.1% |
| Crow | 0.0 /100 | #328 | Tragic 27.7% |
| Immigrants | Central America | 0.0 /100 | #329 | Tragic 27.5% |
| Spanish American Indians | 0.0 /100 | #330 | Tragic 27.5% |
| Immigrants | Azores | 0.0 /100 | #331 | Tragic 27.3% |
| Menominee | 0.0 /100 | #332 | Tragic 27.3% |
| Mexicans | 0.0 /100 | #333 | Tragic 27.1% |
| Arapaho | 0.0 /100 | #334 | Tragic 26.6% |
| Natives/Alaskans | 0.0 /100 | #335 | Tragic 26.3% |
| Immigrants | Mexico | 0.0 /100 | #336 | Tragic 26.1% |
| Inupiat | 0.0 /100 | #337 | Tragic 25.8% |
| Pueblo | 0.0 /100 | #338 | Tragic 25.5% |
| Hopi | 0.0 /100 | #339 | Tragic 25.3% |
| Lumbee | 0.0 /100 | #340 | Tragic 24.8% |
| Yuman | 0.0 /100 | #341 | Tragic 24.5% |
Demographics Similar to Canadians by Bachelor's Degree
In terms of bachelor's degree, the demographic groups most similar to Canadians are Slavic (38.9%, a difference of 0.12%), Immigrants from Kenya (38.8%, a difference of 0.15%), Sudanese (38.9%, a difference of 0.18%), Immigrants from Africa (38.9%, a difference of 0.20%), and South American (38.9%, a difference of 0.29%).
| Demographics | Rating | Rank | Bachelor's Degree |
| Immigrants | Sierra Leone | 79.0 /100 | #147 | Good 39.0% |
| Iraqis | 78.1 /100 | #148 | Good 39.0% |
| Immigrants | Poland | 77.5 /100 | #149 | Good 39.0% |
| South Americans | 77.3 /100 | #150 | Good 38.9% |
| Immigrants | Africa | 76.5 /100 | #151 | Good 38.9% |
| Sudanese | 76.4 /100 | #152 | Good 38.9% |
| Slavs | 75.9 /100 | #153 | Good 38.9% |
| Canadians | 75.0 /100 | #154 | Good 38.8% |
| Immigrants | Kenya | 73.8 /100 | #155 | Good 38.8% |
| Kenyans | 72.5 /100 | #156 | Good 38.7% |
| Immigrants | South America | 70.1 /100 | #157 | Good 38.6% |
| Immigrants | Germany | 69.6 /100 | #158 | Good 38.6% |
| Chinese | 66.6 /100 | #159 | Good 38.5% |
| Vietnamese | 66.6 /100 | #160 | Good 38.5% |
| Uruguayans | 65.8 /100 | #161 | Good 38.4% |