Immigrants from Czechoslovakia vs Canadian Bachelor's Degree
COMPARE
Immigrants from Czechoslovakia
Canadian
Bachelor's Degree
Bachelor's Degree Comparison
Immigrants from Czechoslovakia
Canadians
44.0%
BACHELOR'S DEGREE
99.9/ 100
METRIC RATING
58th/ 347
METRIC RANK
38.8%
BACHELOR'S DEGREE
75.0/ 100
METRIC RATING
154th/ 347
METRIC RANK
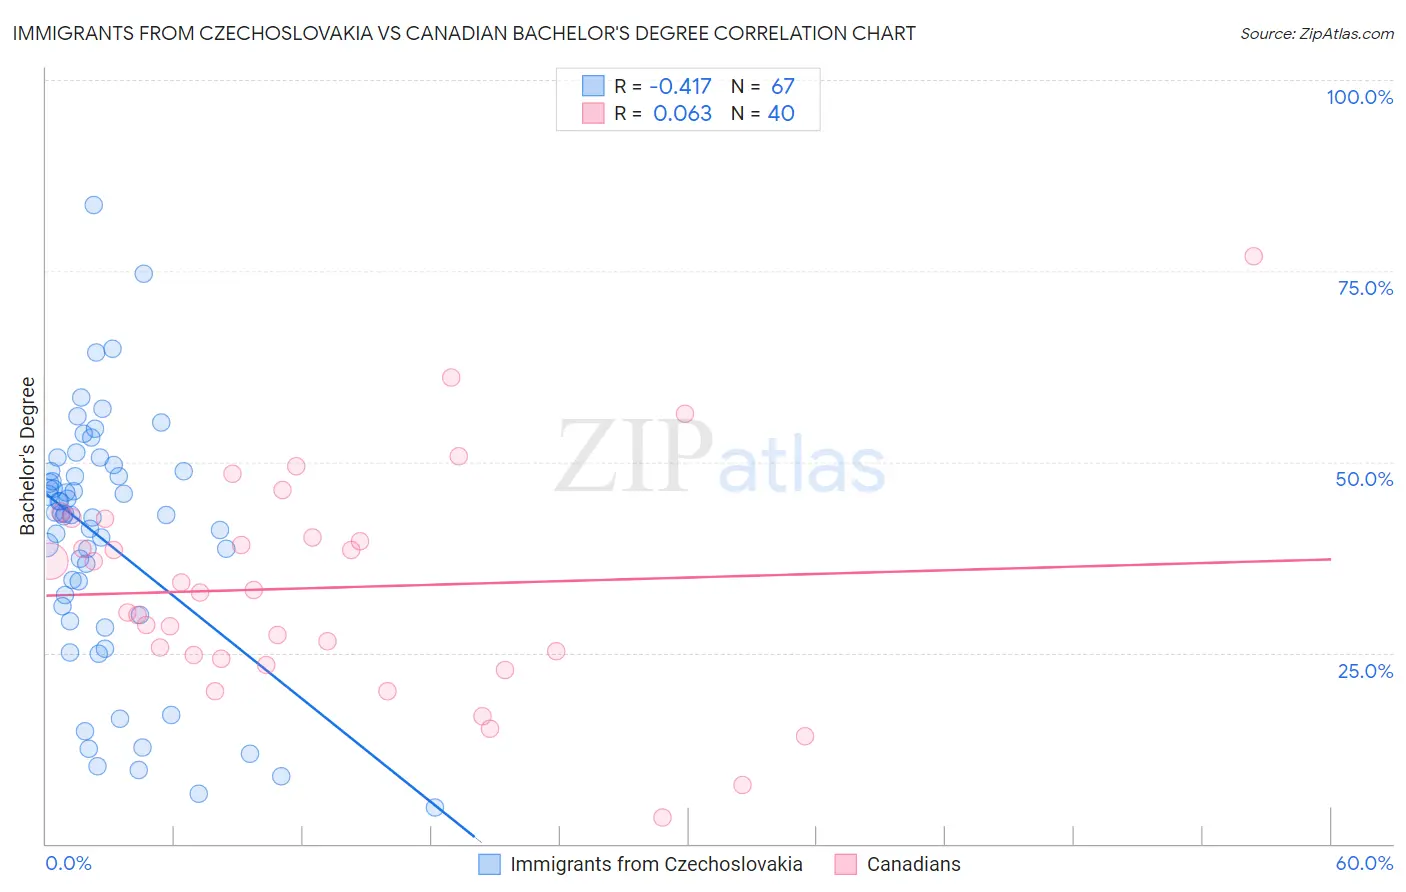
Immigrants from Czechoslovakia vs Canadian Bachelor's Degree Correlation Chart
The statistical analysis conducted on geographies consisting of 195,448,477 people shows a moderate negative correlation between the proportion of Immigrants from Czechoslovakia and percentage of population with at least bachelor's degree education in the United States with a correlation coefficient (R) of -0.417 and weighted average of 44.0%. Similarly, the statistical analysis conducted on geographies consisting of 437,524,144 people shows a slight positive correlation between the proportion of Canadians and percentage of population with at least bachelor's degree education in the United States with a correlation coefficient (R) of 0.063 and weighted average of 38.8%, a difference of 13.4%.
Bachelor's Degree Correlation Summary
| Measurement | Immigrants from Czechoslovakia | Canadian |
| Minimum | 4.8% | 3.4% |
| Maximum | 83.6% | 76.9% |
| Range | 78.9% | 73.5% |
| Mean | 39.6% | 33.5% |
| Median | 43.1% | 33.0% |
| Interquartile 25% (IQ1) | 29.9% | 24.5% |
| Interquartile 75% (IQ3) | 48.7% | 41.3% |
| Interquartile Range (IQR) | 18.8% | 16.8% |
| Standard Deviation (Sample) | 16.3% | 14.5% |
| Standard Deviation (Population) | 16.2% | 14.3% |
Similar Demographics by Bachelor's Degree
Demographics Similar to Immigrants from Czechoslovakia by Bachelor's Degree
In terms of bachelor's degree, the demographic groups most similar to Immigrants from Czechoslovakia are Paraguayan (44.0%, a difference of 0.050%), Australian (44.0%, a difference of 0.10%), New Zealander (44.0%, a difference of 0.11%), Immigrants from Serbia (44.1%, a difference of 0.24%), and Immigrants from Bolivia (44.2%, a difference of 0.42%).
| Demographics | Rating | Rank | Bachelor's Degree |
| Asians | 99.9 /100 | #51 | Exceptional 44.4% |
| Immigrants | Spain | 99.9 /100 | #52 | Exceptional 44.3% |
| Immigrants | Asia | 99.9 /100 | #53 | Exceptional 44.3% |
| Immigrants | Austria | 99.9 /100 | #54 | Exceptional 44.2% |
| Immigrants | Bolivia | 99.9 /100 | #55 | Exceptional 44.2% |
| Immigrants | Serbia | 99.9 /100 | #56 | Exceptional 44.1% |
| Paraguayans | 99.9 /100 | #57 | Exceptional 44.0% |
| Immigrants | Czechoslovakia | 99.9 /100 | #58 | Exceptional 44.0% |
| Australians | 99.9 /100 | #59 | Exceptional 44.0% |
| New Zealanders | 99.9 /100 | #60 | Exceptional 44.0% |
| South Africans | 99.8 /100 | #61 | Exceptional 43.6% |
| Immigrants | Kazakhstan | 99.8 /100 | #62 | Exceptional 43.4% |
| Immigrants | Europe | 99.8 /100 | #63 | Exceptional 43.4% |
| Argentineans | 99.7 /100 | #64 | Exceptional 43.3% |
| Zimbabweans | 99.7 /100 | #65 | Exceptional 43.3% |
Demographics Similar to Canadians by Bachelor's Degree
In terms of bachelor's degree, the demographic groups most similar to Canadians are Slavic (38.9%, a difference of 0.12%), Immigrants from Kenya (38.8%, a difference of 0.15%), Sudanese (38.9%, a difference of 0.18%), Immigrants from Africa (38.9%, a difference of 0.20%), and South American (38.9%, a difference of 0.29%).
| Demographics | Rating | Rank | Bachelor's Degree |
| Immigrants | Sierra Leone | 79.0 /100 | #147 | Good 39.0% |
| Iraqis | 78.1 /100 | #148 | Good 39.0% |
| Immigrants | Poland | 77.5 /100 | #149 | Good 39.0% |
| South Americans | 77.3 /100 | #150 | Good 38.9% |
| Immigrants | Africa | 76.5 /100 | #151 | Good 38.9% |
| Sudanese | 76.4 /100 | #152 | Good 38.9% |
| Slavs | 75.9 /100 | #153 | Good 38.9% |
| Canadians | 75.0 /100 | #154 | Good 38.8% |
| Immigrants | Kenya | 73.8 /100 | #155 | Good 38.8% |
| Kenyans | 72.5 /100 | #156 | Good 38.7% |
| Immigrants | South America | 70.1 /100 | #157 | Good 38.6% |
| Immigrants | Germany | 69.6 /100 | #158 | Good 38.6% |
| Chinese | 66.6 /100 | #159 | Good 38.5% |
| Vietnamese | 66.6 /100 | #160 | Good 38.5% |
| Uruguayans | 65.8 /100 | #161 | Good 38.4% |