Arapaho vs Immigrants from Latvia Bachelor's Degree
COMPARE
Arapaho
Immigrants from Latvia
Bachelor's Degree
Bachelor's Degree Comparison
Arapaho
Immigrants from Latvia
26.6%
BACHELOR'S DEGREE
0.0/ 100
METRIC RATING
334th/ 347
METRIC RANK
45.1%
BACHELOR'S DEGREE
100.0/ 100
METRIC RATING
39th/ 347
METRIC RANK
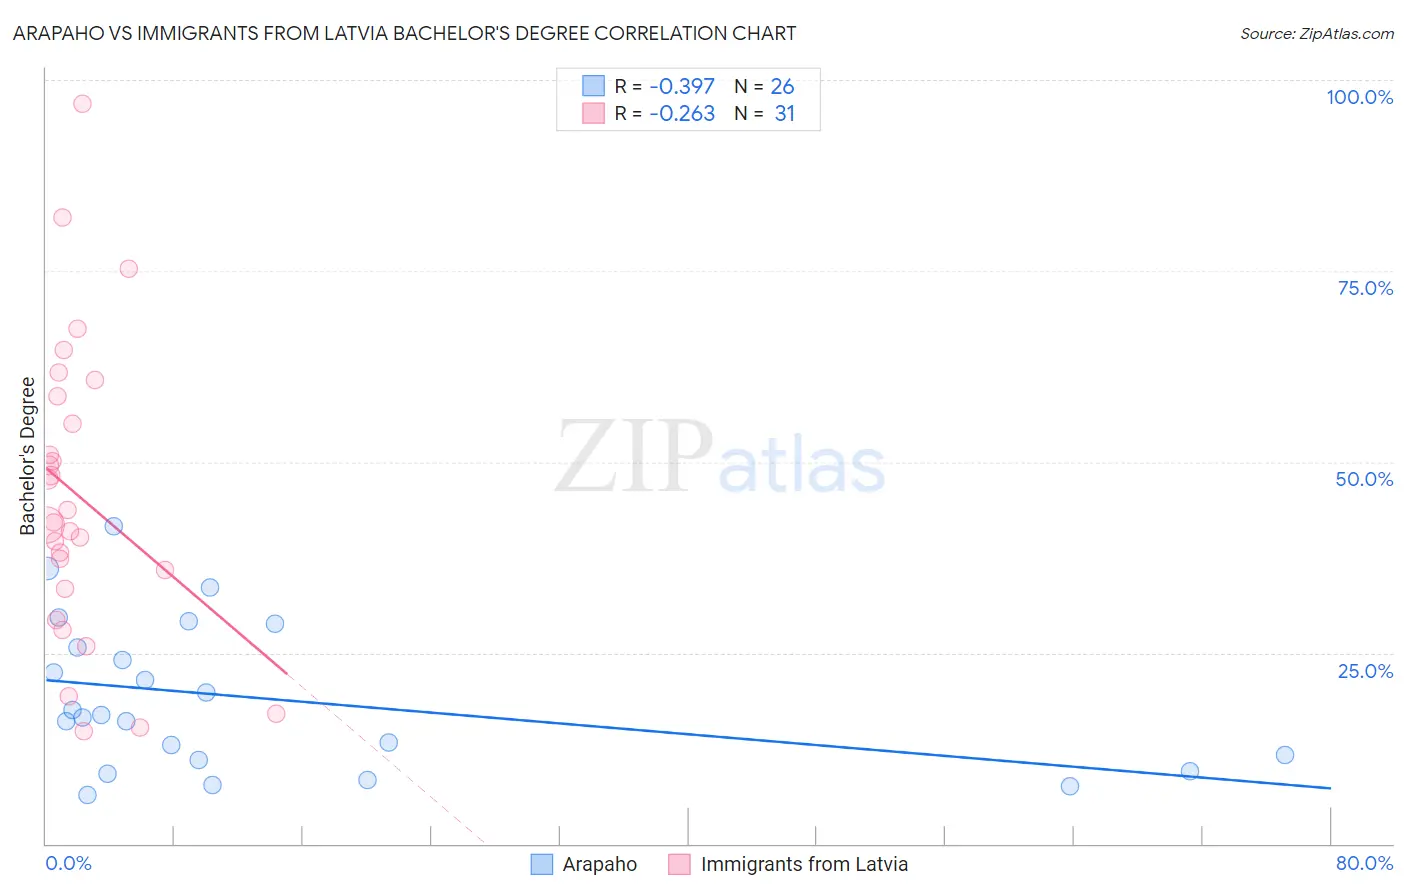
Arapaho vs Immigrants from Latvia Bachelor's Degree Correlation Chart
The statistical analysis conducted on geographies consisting of 29,779,045 people shows a mild negative correlation between the proportion of Arapaho and percentage of population with at least bachelor's degree education in the United States with a correlation coefficient (R) of -0.397 and weighted average of 26.6%. Similarly, the statistical analysis conducted on geographies consisting of 113,735,345 people shows a weak negative correlation between the proportion of Immigrants from Latvia and percentage of population with at least bachelor's degree education in the United States with a correlation coefficient (R) of -0.263 and weighted average of 45.1%, a difference of 69.6%.
Bachelor's Degree Correlation Summary
| Measurement | Arapaho | Immigrants from Latvia |
| Minimum | 6.4% | 14.7% |
| Maximum | 41.6% | 96.9% |
| Range | 35.1% | 82.2% |
| Mean | 18.9% | 45.5% |
| Median | 16.7% | 42.0% |
| Interquartile 25% (IQ1) | 11.0% | 33.3% |
| Interquartile 75% (IQ3) | 25.8% | 58.6% |
| Interquartile Range (IQR) | 14.8% | 25.3% |
| Standard Deviation (Sample) | 9.7% | 19.4% |
| Standard Deviation (Population) | 9.5% | 19.1% |
Similar Demographics by Bachelor's Degree
Demographics Similar to Arapaho by Bachelor's Degree
In terms of bachelor's degree, the demographic groups most similar to Arapaho are Native/Alaskan (26.3%, a difference of 1.1%), Mexican (27.1%, a difference of 1.7%), Immigrants from Mexico (26.1%, a difference of 1.9%), Menominee (27.3%, a difference of 2.5%), and Immigrants from the Azores (27.3%, a difference of 2.6%).
| Demographics | Rating | Rank | Bachelor's Degree |
| Paiute | 0.0 /100 | #327 | Tragic 28.1% |
| Crow | 0.0 /100 | #328 | Tragic 27.7% |
| Immigrants | Central America | 0.0 /100 | #329 | Tragic 27.5% |
| Spanish American Indians | 0.0 /100 | #330 | Tragic 27.5% |
| Immigrants | Azores | 0.0 /100 | #331 | Tragic 27.3% |
| Menominee | 0.0 /100 | #332 | Tragic 27.3% |
| Mexicans | 0.0 /100 | #333 | Tragic 27.1% |
| Arapaho | 0.0 /100 | #334 | Tragic 26.6% |
| Natives/Alaskans | 0.0 /100 | #335 | Tragic 26.3% |
| Immigrants | Mexico | 0.0 /100 | #336 | Tragic 26.1% |
| Inupiat | 0.0 /100 | #337 | Tragic 25.8% |
| Pueblo | 0.0 /100 | #338 | Tragic 25.5% |
| Hopi | 0.0 /100 | #339 | Tragic 25.3% |
| Lumbee | 0.0 /100 | #340 | Tragic 24.8% |
| Yuman | 0.0 /100 | #341 | Tragic 24.5% |
Demographics Similar to Immigrants from Latvia by Bachelor's Degree
In terms of bachelor's degree, the demographic groups most similar to Immigrants from Latvia are Immigrants from Belarus (45.0%, a difference of 0.27%), Immigrants from Malaysia (45.0%, a difference of 0.31%), Bulgarian (45.3%, a difference of 0.33%), Russian (45.3%, a difference of 0.42%), and Mongolian (45.4%, a difference of 0.57%).
| Demographics | Rating | Rank | Bachelor's Degree |
| Immigrants | Turkey | 100.0 /100 | #32 | Exceptional 46.0% |
| Immigrants | Northern Europe | 100.0 /100 | #33 | Exceptional 45.6% |
| Immigrants | Denmark | 100.0 /100 | #34 | Exceptional 45.4% |
| Immigrants | Russia | 100.0 /100 | #35 | Exceptional 45.4% |
| Mongolians | 100.0 /100 | #36 | Exceptional 45.4% |
| Russians | 100.0 /100 | #37 | Exceptional 45.3% |
| Bulgarians | 100.0 /100 | #38 | Exceptional 45.3% |
| Immigrants | Latvia | 100.0 /100 | #39 | Exceptional 45.1% |
| Immigrants | Belarus | 100.0 /100 | #40 | Exceptional 45.0% |
| Immigrants | Malaysia | 100.0 /100 | #41 | Exceptional 45.0% |
| Immigrants | Saudi Arabia | 100.0 /100 | #42 | Exceptional 44.8% |
| Immigrants | South Africa | 99.9 /100 | #43 | Exceptional 44.8% |
| Immigrants | Lithuania | 99.9 /100 | #44 | Exceptional 44.6% |
| Immigrants | Kuwait | 99.9 /100 | #45 | Exceptional 44.6% |
| Immigrants | Bulgaria | 99.9 /100 | #46 | Exceptional 44.6% |