Immigrants from Morocco vs Canadian Bachelor's Degree
COMPARE
Immigrants from Morocco
Canadian
Bachelor's Degree
Bachelor's Degree Comparison
Immigrants from Morocco
Canadians
41.4%
BACHELOR'S DEGREE
98.0/ 100
METRIC RATING
101st/ 347
METRIC RANK
38.8%
BACHELOR'S DEGREE
75.0/ 100
METRIC RATING
154th/ 347
METRIC RANK
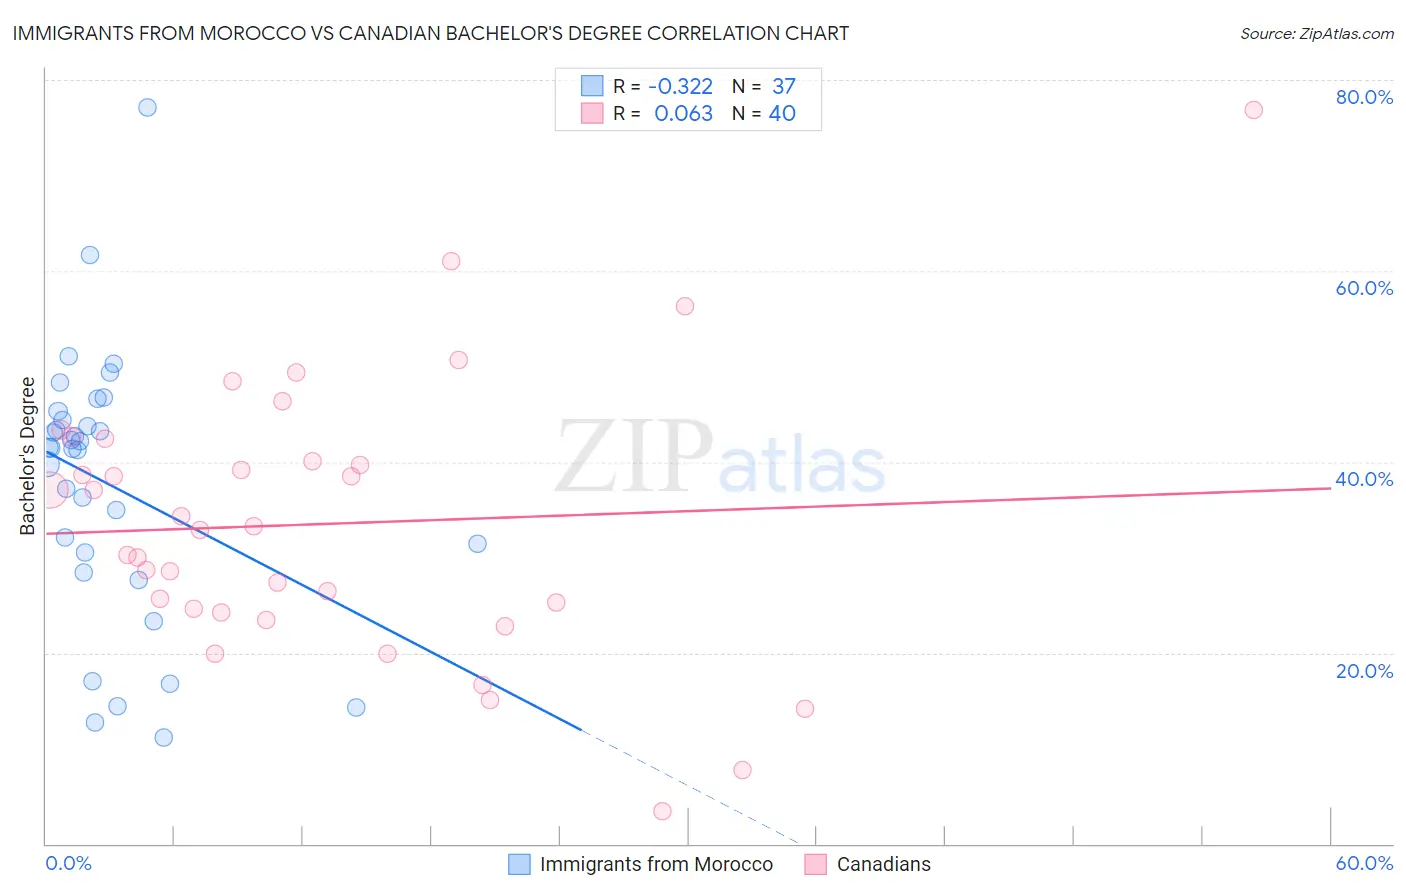
Immigrants from Morocco vs Canadian Bachelor's Degree Correlation Chart
The statistical analysis conducted on geographies consisting of 178,912,438 people shows a mild negative correlation between the proportion of Immigrants from Morocco and percentage of population with at least bachelor's degree education in the United States with a correlation coefficient (R) of -0.322 and weighted average of 41.4%. Similarly, the statistical analysis conducted on geographies consisting of 437,524,144 people shows a slight positive correlation between the proportion of Canadians and percentage of population with at least bachelor's degree education in the United States with a correlation coefficient (R) of 0.063 and weighted average of 38.8%, a difference of 6.7%.
Bachelor's Degree Correlation Summary
| Measurement | Immigrants from Morocco | Canadian |
| Minimum | 11.1% | 3.4% |
| Maximum | 77.2% | 76.9% |
| Range | 66.0% | 73.5% |
| Mean | 37.7% | 33.5% |
| Median | 41.4% | 33.0% |
| Interquartile 25% (IQ1) | 29.5% | 24.5% |
| Interquartile 75% (IQ3) | 44.9% | 41.3% |
| Interquartile Range (IQR) | 15.4% | 16.8% |
| Standard Deviation (Sample) | 14.0% | 14.5% |
| Standard Deviation (Population) | 13.8% | 14.3% |
Similar Demographics by Bachelor's Degree
Demographics Similar to Immigrants from Morocco by Bachelor's Degree
In terms of bachelor's degree, the demographic groups most similar to Immigrants from Morocco are Macedonian (41.4%, a difference of 0.030%), Immigrants from England (41.4%, a difference of 0.060%), Immigrants from Italy (41.3%, a difference of 0.26%), Immigrants from Ukraine (41.5%, a difference of 0.29%), and Romanian (41.6%, a difference of 0.40%).
| Demographics | Rating | Rank | Bachelor's Degree |
| Immigrants | Nepal | 98.6 /100 | #94 | Exceptional 41.7% |
| Immigrants | North America | 98.5 /100 | #95 | Exceptional 41.7% |
| Immigrants | Moldova | 98.4 /100 | #96 | Exceptional 41.6% |
| Romanians | 98.4 /100 | #97 | Exceptional 41.6% |
| Immigrants | Ukraine | 98.3 /100 | #98 | Exceptional 41.5% |
| Immigrants | England | 98.1 /100 | #99 | Exceptional 41.4% |
| Macedonians | 98.1 /100 | #100 | Exceptional 41.4% |
| Immigrants | Morocco | 98.0 /100 | #101 | Exceptional 41.4% |
| Immigrants | Italy | 97.8 /100 | #102 | Exceptional 41.3% |
| Chileans | 97.5 /100 | #103 | Exceptional 41.2% |
| Jordanians | 97.4 /100 | #104 | Exceptional 41.2% |
| Syrians | 97.4 /100 | #105 | Exceptional 41.1% |
| Alsatians | 97.0 /100 | #106 | Exceptional 41.0% |
| Northern Europeans | 96.8 /100 | #107 | Exceptional 41.0% |
| Ukrainians | 96.6 /100 | #108 | Exceptional 40.9% |
Demographics Similar to Canadians by Bachelor's Degree
In terms of bachelor's degree, the demographic groups most similar to Canadians are Slavic (38.9%, a difference of 0.12%), Immigrants from Kenya (38.8%, a difference of 0.15%), Sudanese (38.9%, a difference of 0.18%), Immigrants from Africa (38.9%, a difference of 0.20%), and South American (38.9%, a difference of 0.29%).
| Demographics | Rating | Rank | Bachelor's Degree |
| Immigrants | Sierra Leone | 79.0 /100 | #147 | Good 39.0% |
| Iraqis | 78.1 /100 | #148 | Good 39.0% |
| Immigrants | Poland | 77.5 /100 | #149 | Good 39.0% |
| South Americans | 77.3 /100 | #150 | Good 38.9% |
| Immigrants | Africa | 76.5 /100 | #151 | Good 38.9% |
| Sudanese | 76.4 /100 | #152 | Good 38.9% |
| Slavs | 75.9 /100 | #153 | Good 38.9% |
| Canadians | 75.0 /100 | #154 | Good 38.8% |
| Immigrants | Kenya | 73.8 /100 | #155 | Good 38.8% |
| Kenyans | 72.5 /100 | #156 | Good 38.7% |
| Immigrants | South America | 70.1 /100 | #157 | Good 38.6% |
| Immigrants | Germany | 69.6 /100 | #158 | Good 38.6% |
| Chinese | 66.6 /100 | #159 | Good 38.5% |
| Vietnamese | 66.6 /100 | #160 | Good 38.5% |
| Uruguayans | 65.8 /100 | #161 | Good 38.4% |