Immigrants from Northern Africa vs Canadian Bachelor's Degree
COMPARE
Immigrants from Northern Africa
Canadian
Bachelor's Degree
Bachelor's Degree Comparison
Immigrants from Northern Africa
Canadians
41.9%
BACHELOR'S DEGREE
98.9/ 100
METRIC RATING
91st/ 347
METRIC RANK
38.8%
BACHELOR'S DEGREE
75.0/ 100
METRIC RATING
154th/ 347
METRIC RANK
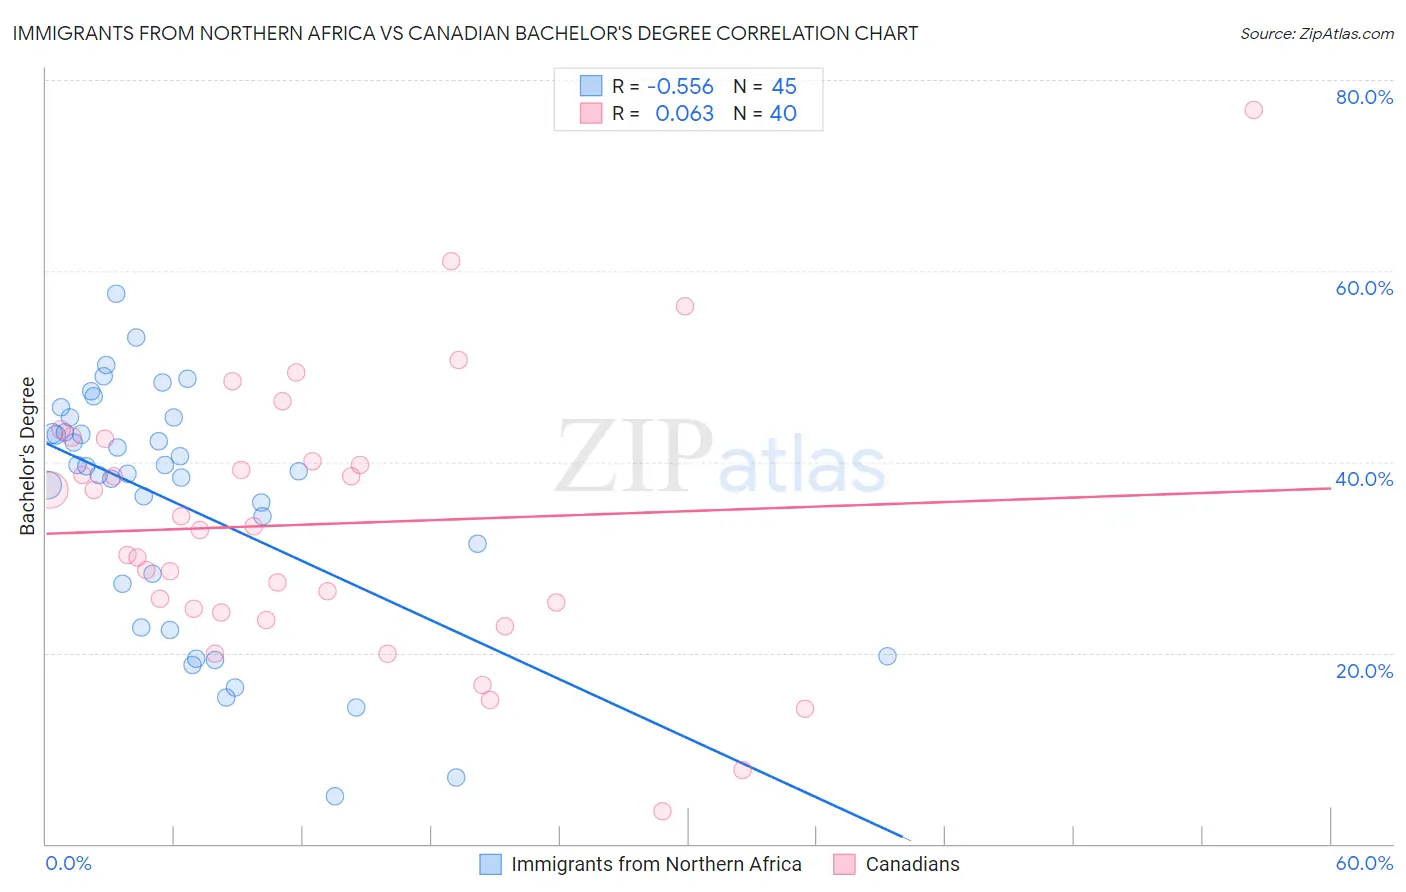
Immigrants from Northern Africa vs Canadian Bachelor's Degree Correlation Chart
The statistical analysis conducted on geographies consisting of 321,192,912 people shows a substantial negative correlation between the proportion of Immigrants from Northern Africa and percentage of population with at least bachelor's degree education in the United States with a correlation coefficient (R) of -0.556 and weighted average of 41.9%. Similarly, the statistical analysis conducted on geographies consisting of 437,524,144 people shows a slight positive correlation between the proportion of Canadians and percentage of population with at least bachelor's degree education in the United States with a correlation coefficient (R) of 0.063 and weighted average of 38.8%, a difference of 8.0%.
Bachelor's Degree Correlation Summary
| Measurement | Immigrants from Northern Africa | Canadian |
| Minimum | 5.0% | 3.4% |
| Maximum | 57.6% | 76.9% |
| Range | 52.6% | 73.5% |
| Mean | 35.5% | 33.5% |
| Median | 39.1% | 33.0% |
| Interquartile 25% (IQ1) | 24.9% | 24.5% |
| Interquartile 75% (IQ3) | 43.8% | 41.3% |
| Interquartile Range (IQR) | 18.9% | 16.8% |
| Standard Deviation (Sample) | 12.7% | 14.5% |
| Standard Deviation (Population) | 12.5% | 14.3% |
Similar Demographics by Bachelor's Degree
Demographics Similar to Immigrants from Northern Africa by Bachelor's Degree
In terms of bachelor's degree, the demographic groups most similar to Immigrants from Northern Africa are Maltese (41.9%, a difference of 0.070%), Laotian (42.0%, a difference of 0.10%), Greek (42.0%, a difference of 0.22%), Immigrants from Western Europe (42.0%, a difference of 0.23%), and Carpatho Rusyn (42.1%, a difference of 0.35%).
| Demographics | Rating | Rank | Bachelor's Degree |
| Immigrants | Western Asia | 99.2 /100 | #84 | Exceptional 42.3% |
| Lithuanians | 99.2 /100 | #85 | Exceptional 42.2% |
| Immigrants | Brazil | 99.2 /100 | #86 | Exceptional 42.2% |
| Carpatho Rusyns | 99.0 /100 | #87 | Exceptional 42.1% |
| Immigrants | Western Europe | 99.0 /100 | #88 | Exceptional 42.0% |
| Greeks | 99.0 /100 | #89 | Exceptional 42.0% |
| Laotians | 98.9 /100 | #90 | Exceptional 42.0% |
| Immigrants | Northern Africa | 98.9 /100 | #91 | Exceptional 41.9% |
| Maltese | 98.8 /100 | #92 | Exceptional 41.9% |
| Immigrants | Canada | 98.6 /100 | #93 | Exceptional 41.7% |
| Immigrants | Nepal | 98.6 /100 | #94 | Exceptional 41.7% |
| Immigrants | North America | 98.5 /100 | #95 | Exceptional 41.7% |
| Immigrants | Moldova | 98.4 /100 | #96 | Exceptional 41.6% |
| Romanians | 98.4 /100 | #97 | Exceptional 41.6% |
| Immigrants | Ukraine | 98.3 /100 | #98 | Exceptional 41.5% |
Demographics Similar to Canadians by Bachelor's Degree
In terms of bachelor's degree, the demographic groups most similar to Canadians are Slavic (38.9%, a difference of 0.12%), Immigrants from Kenya (38.8%, a difference of 0.15%), Sudanese (38.9%, a difference of 0.18%), Immigrants from Africa (38.9%, a difference of 0.20%), and South American (38.9%, a difference of 0.29%).
| Demographics | Rating | Rank | Bachelor's Degree |
| Immigrants | Sierra Leone | 79.0 /100 | #147 | Good 39.0% |
| Iraqis | 78.1 /100 | #148 | Good 39.0% |
| Immigrants | Poland | 77.5 /100 | #149 | Good 39.0% |
| South Americans | 77.3 /100 | #150 | Good 38.9% |
| Immigrants | Africa | 76.5 /100 | #151 | Good 38.9% |
| Sudanese | 76.4 /100 | #152 | Good 38.9% |
| Slavs | 75.9 /100 | #153 | Good 38.9% |
| Canadians | 75.0 /100 | #154 | Good 38.8% |
| Immigrants | Kenya | 73.8 /100 | #155 | Good 38.8% |
| Kenyans | 72.5 /100 | #156 | Good 38.7% |
| Immigrants | South America | 70.1 /100 | #157 | Good 38.6% |
| Immigrants | Germany | 69.6 /100 | #158 | Good 38.6% |
| Chinese | 66.6 /100 | #159 | Good 38.5% |
| Vietnamese | 66.6 /100 | #160 | Good 38.5% |
| Uruguayans | 65.8 /100 | #161 | Good 38.4% |