Paraguayan vs Canadian Bachelor's Degree
COMPARE
Paraguayan
Canadian
Bachelor's Degree
Bachelor's Degree Comparison
Paraguayans
Canadians
44.0%
BACHELOR'S DEGREE
99.9/ 100
METRIC RATING
57th/ 347
METRIC RANK
38.8%
BACHELOR'S DEGREE
75.0/ 100
METRIC RATING
154th/ 347
METRIC RANK
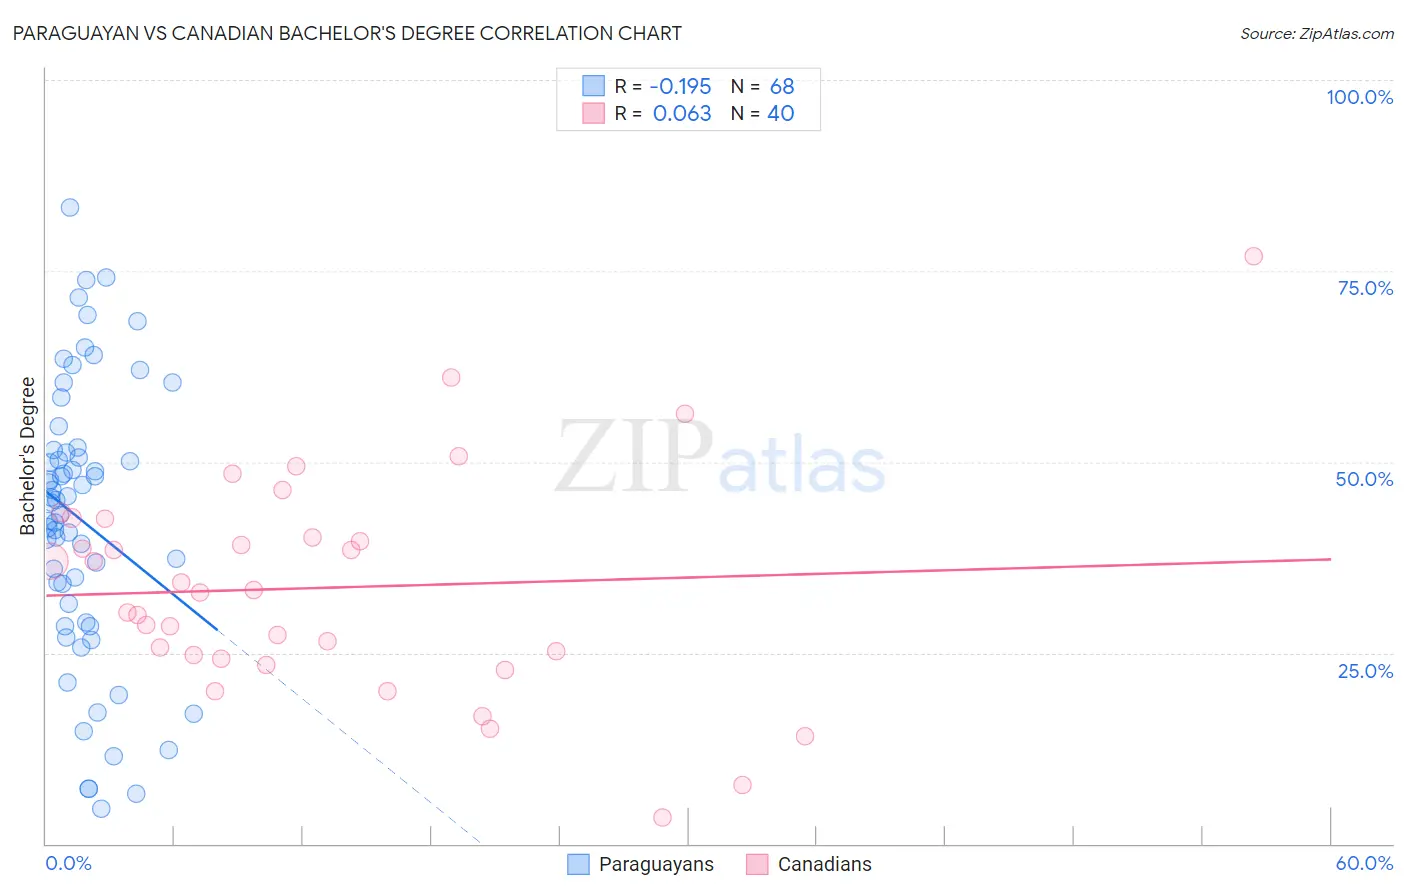
Paraguayan vs Canadian Bachelor's Degree Correlation Chart
The statistical analysis conducted on geographies consisting of 95,113,072 people shows a poor negative correlation between the proportion of Paraguayans and percentage of population with at least bachelor's degree education in the United States with a correlation coefficient (R) of -0.195 and weighted average of 44.0%. Similarly, the statistical analysis conducted on geographies consisting of 437,524,144 people shows a slight positive correlation between the proportion of Canadians and percentage of population with at least bachelor's degree education in the United States with a correlation coefficient (R) of 0.063 and weighted average of 38.8%, a difference of 13.4%.
Bachelor's Degree Correlation Summary
| Measurement | Paraguayan | Canadian |
| Minimum | 4.5% | 3.4% |
| Maximum | 83.2% | 76.9% |
| Range | 78.7% | 73.5% |
| Mean | 42.3% | 33.5% |
| Median | 44.9% | 33.0% |
| Interquartile 25% (IQ1) | 30.2% | 24.5% |
| Interquartile 75% (IQ3) | 51.4% | 41.3% |
| Interquartile Range (IQR) | 21.2% | 16.8% |
| Standard Deviation (Sample) | 18.1% | 14.5% |
| Standard Deviation (Population) | 17.9% | 14.3% |
Similar Demographics by Bachelor's Degree
Demographics Similar to Paraguayans by Bachelor's Degree
In terms of bachelor's degree, the demographic groups most similar to Paraguayans are Immigrants from Czechoslovakia (44.0%, a difference of 0.050%), Australian (44.0%, a difference of 0.16%), New Zealander (44.0%, a difference of 0.16%), Immigrants from Serbia (44.1%, a difference of 0.19%), and Immigrants from Austria (44.2%, a difference of 0.37%).
| Demographics | Rating | Rank | Bachelor's Degree |
| Immigrants | Greece | 99.9 /100 | #50 | Exceptional 44.5% |
| Asians | 99.9 /100 | #51 | Exceptional 44.4% |
| Immigrants | Spain | 99.9 /100 | #52 | Exceptional 44.3% |
| Immigrants | Asia | 99.9 /100 | #53 | Exceptional 44.3% |
| Immigrants | Austria | 99.9 /100 | #54 | Exceptional 44.2% |
| Immigrants | Bolivia | 99.9 /100 | #55 | Exceptional 44.2% |
| Immigrants | Serbia | 99.9 /100 | #56 | Exceptional 44.1% |
| Paraguayans | 99.9 /100 | #57 | Exceptional 44.0% |
| Immigrants | Czechoslovakia | 99.9 /100 | #58 | Exceptional 44.0% |
| Australians | 99.9 /100 | #59 | Exceptional 44.0% |
| New Zealanders | 99.9 /100 | #60 | Exceptional 44.0% |
| South Africans | 99.8 /100 | #61 | Exceptional 43.6% |
| Immigrants | Kazakhstan | 99.8 /100 | #62 | Exceptional 43.4% |
| Immigrants | Europe | 99.8 /100 | #63 | Exceptional 43.4% |
| Argentineans | 99.7 /100 | #64 | Exceptional 43.3% |
Demographics Similar to Canadians by Bachelor's Degree
In terms of bachelor's degree, the demographic groups most similar to Canadians are Slavic (38.9%, a difference of 0.12%), Immigrants from Kenya (38.8%, a difference of 0.15%), Sudanese (38.9%, a difference of 0.18%), Immigrants from Africa (38.9%, a difference of 0.20%), and South American (38.9%, a difference of 0.29%).
| Demographics | Rating | Rank | Bachelor's Degree |
| Immigrants | Sierra Leone | 79.0 /100 | #147 | Good 39.0% |
| Iraqis | 78.1 /100 | #148 | Good 39.0% |
| Immigrants | Poland | 77.5 /100 | #149 | Good 39.0% |
| South Americans | 77.3 /100 | #150 | Good 38.9% |
| Immigrants | Africa | 76.5 /100 | #151 | Good 38.9% |
| Sudanese | 76.4 /100 | #152 | Good 38.9% |
| Slavs | 75.9 /100 | #153 | Good 38.9% |
| Canadians | 75.0 /100 | #154 | Good 38.8% |
| Immigrants | Kenya | 73.8 /100 | #155 | Good 38.8% |
| Kenyans | 72.5 /100 | #156 | Good 38.7% |
| Immigrants | South America | 70.1 /100 | #157 | Good 38.6% |
| Immigrants | Germany | 69.6 /100 | #158 | Good 38.6% |
| Chinese | 66.6 /100 | #159 | Good 38.5% |
| Vietnamese | 66.6 /100 | #160 | Good 38.5% |
| Uruguayans | 65.8 /100 | #161 | Good 38.4% |