Immigrants from Uganda vs Canadian Bachelor's Degree
COMPARE
Immigrants from Uganda
Canadian
Bachelor's Degree
Bachelor's Degree Comparison
Immigrants from Uganda
Canadians
40.7%
BACHELOR'S DEGREE
95.7/ 100
METRIC RATING
116th/ 347
METRIC RANK
38.8%
BACHELOR'S DEGREE
75.0/ 100
METRIC RATING
154th/ 347
METRIC RANK
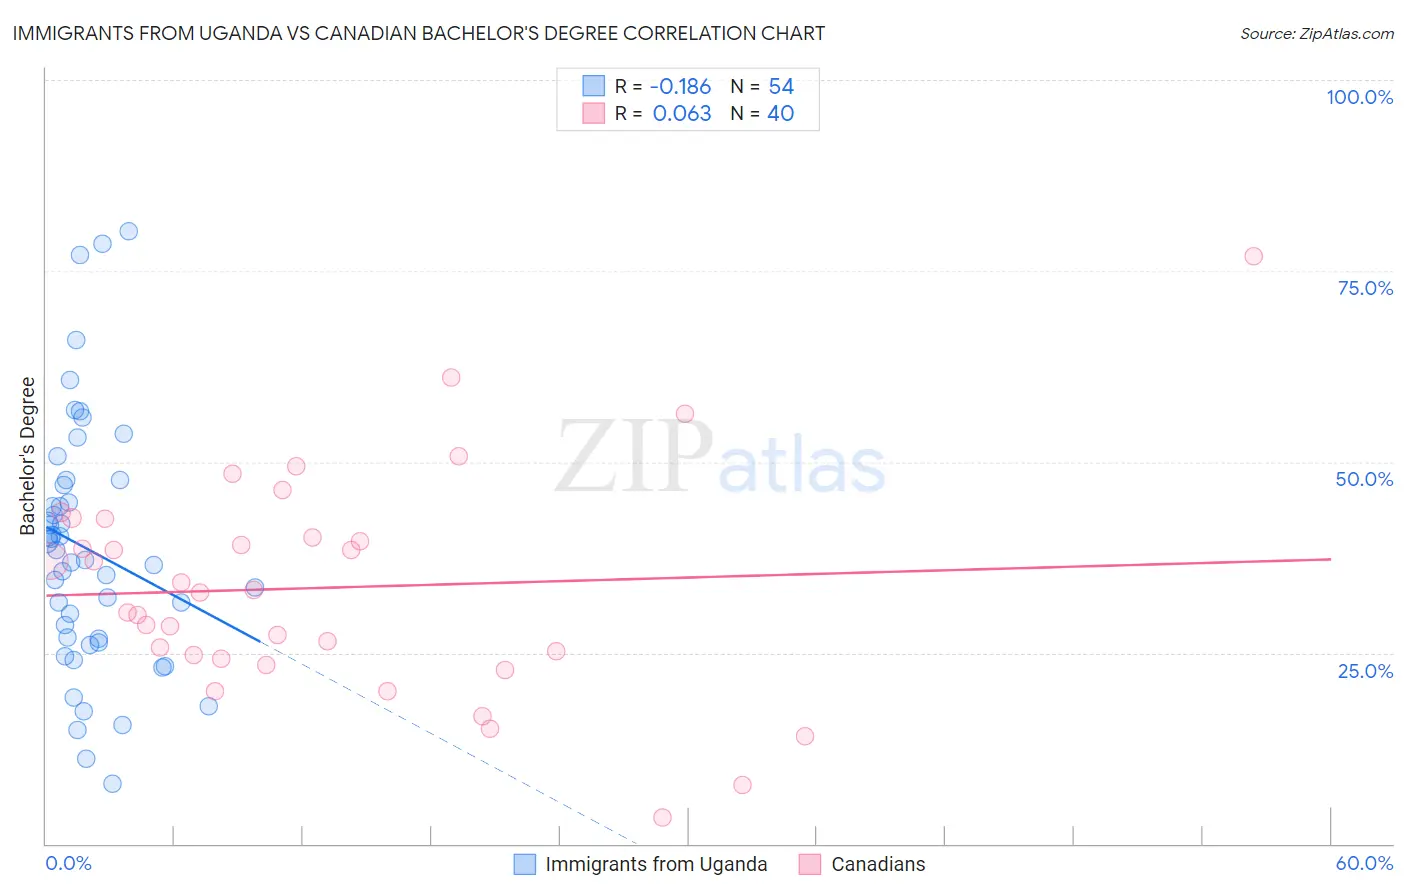
Immigrants from Uganda vs Canadian Bachelor's Degree Correlation Chart
The statistical analysis conducted on geographies consisting of 125,980,358 people shows a poor negative correlation between the proportion of Immigrants from Uganda and percentage of population with at least bachelor's degree education in the United States with a correlation coefficient (R) of -0.186 and weighted average of 40.7%. Similarly, the statistical analysis conducted on geographies consisting of 437,524,144 people shows a slight positive correlation between the proportion of Canadians and percentage of population with at least bachelor's degree education in the United States with a correlation coefficient (R) of 0.063 and weighted average of 38.8%, a difference of 4.8%.
Bachelor's Degree Correlation Summary
| Measurement | Immigrants from Uganda | Canadian |
| Minimum | 7.9% | 3.4% |
| Maximum | 80.2% | 76.9% |
| Range | 72.3% | 73.5% |
| Mean | 38.5% | 33.5% |
| Median | 37.9% | 33.0% |
| Interquartile 25% (IQ1) | 26.9% | 24.5% |
| Interquartile 75% (IQ3) | 47.0% | 41.3% |
| Interquartile Range (IQR) | 20.2% | 16.8% |
| Standard Deviation (Sample) | 16.2% | 14.5% |
| Standard Deviation (Population) | 16.0% | 14.3% |
Similar Demographics by Bachelor's Degree
Demographics Similar to Immigrants from Uganda by Bachelor's Degree
In terms of bachelor's degree, the demographic groups most similar to Immigrants from Uganda are Palestinian (40.7%, a difference of 0.050%), Austrian (40.6%, a difference of 0.10%), Croatian (40.6%, a difference of 0.12%), Afghan (40.8%, a difference of 0.29%), and Brazilian (40.8%, a difference of 0.32%).
| Demographics | Rating | Rank | Bachelor's Degree |
| Arabs | 96.6 /100 | #109 | Exceptional 40.9% |
| Albanians | 96.5 /100 | #110 | Exceptional 40.9% |
| Immigrants | Chile | 96.4 /100 | #111 | Exceptional 40.8% |
| Ugandans | 96.3 /100 | #112 | Exceptional 40.8% |
| Brazilians | 96.3 /100 | #113 | Exceptional 40.8% |
| Afghans | 96.2 /100 | #114 | Exceptional 40.8% |
| Palestinians | 95.8 /100 | #115 | Exceptional 40.7% |
| Immigrants | Uganda | 95.7 /100 | #116 | Exceptional 40.7% |
| Austrians | 95.5 /100 | #117 | Exceptional 40.6% |
| Croatians | 95.5 /100 | #118 | Exceptional 40.6% |
| Immigrants | Syria | 94.9 /100 | #119 | Exceptional 40.5% |
| Venezuelans | 94.7 /100 | #120 | Exceptional 40.5% |
| Moroccans | 94.6 /100 | #121 | Exceptional 40.5% |
| Immigrants | Albania | 94.4 /100 | #122 | Exceptional 40.4% |
| Lebanese | 94.3 /100 | #123 | Exceptional 40.4% |
Demographics Similar to Canadians by Bachelor's Degree
In terms of bachelor's degree, the demographic groups most similar to Canadians are Slavic (38.9%, a difference of 0.12%), Immigrants from Kenya (38.8%, a difference of 0.15%), Sudanese (38.9%, a difference of 0.18%), Immigrants from Africa (38.9%, a difference of 0.20%), and South American (38.9%, a difference of 0.29%).
| Demographics | Rating | Rank | Bachelor's Degree |
| Immigrants | Sierra Leone | 79.0 /100 | #147 | Good 39.0% |
| Iraqis | 78.1 /100 | #148 | Good 39.0% |
| Immigrants | Poland | 77.5 /100 | #149 | Good 39.0% |
| South Americans | 77.3 /100 | #150 | Good 38.9% |
| Immigrants | Africa | 76.5 /100 | #151 | Good 38.9% |
| Sudanese | 76.4 /100 | #152 | Good 38.9% |
| Slavs | 75.9 /100 | #153 | Good 38.9% |
| Canadians | 75.0 /100 | #154 | Good 38.8% |
| Immigrants | Kenya | 73.8 /100 | #155 | Good 38.8% |
| Kenyans | 72.5 /100 | #156 | Good 38.7% |
| Immigrants | South America | 70.1 /100 | #157 | Good 38.6% |
| Immigrants | Germany | 69.6 /100 | #158 | Good 38.6% |
| Chinese | 66.6 /100 | #159 | Good 38.5% |
| Vietnamese | 66.6 /100 | #160 | Good 38.5% |
| Uruguayans | 65.8 /100 | #161 | Good 38.4% |