Bermudan vs Canadian Bachelor's Degree
COMPARE
Bermudan
Canadian
Bachelor's Degree
Bachelor's Degree Comparison
Bermudans
Canadians
38.0%
BACHELOR'S DEGREE
54.2/ 100
METRIC RATING
171st/ 347
METRIC RANK
38.8%
BACHELOR'S DEGREE
75.0/ 100
METRIC RATING
154th/ 347
METRIC RANK
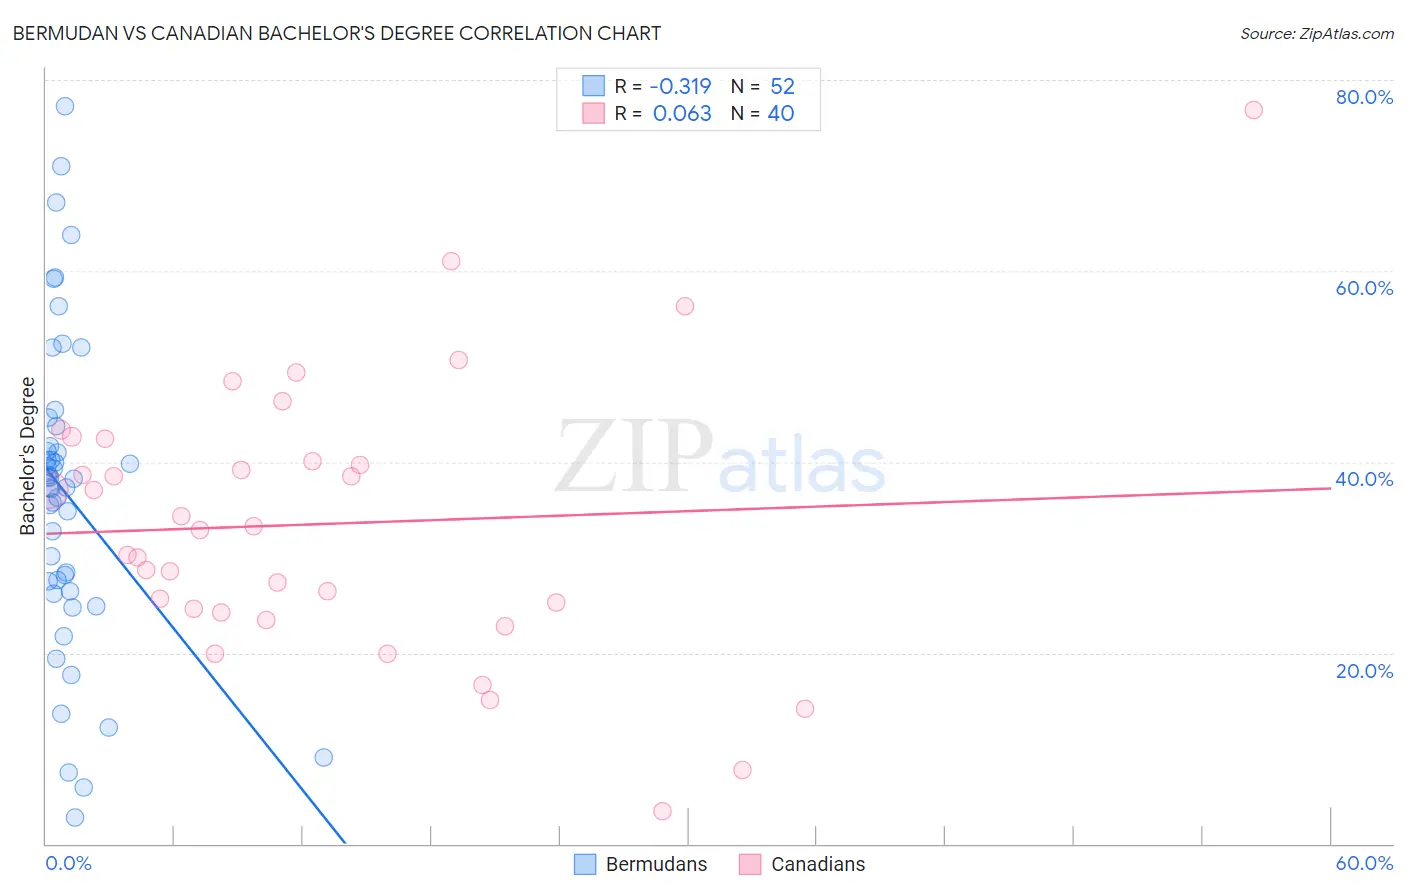
Bermudan vs Canadian Bachelor's Degree Correlation Chart
The statistical analysis conducted on geographies consisting of 55,732,325 people shows a mild negative correlation between the proportion of Bermudans and percentage of population with at least bachelor's degree education in the United States with a correlation coefficient (R) of -0.319 and weighted average of 38.0%. Similarly, the statistical analysis conducted on geographies consisting of 437,524,144 people shows a slight positive correlation between the proportion of Canadians and percentage of population with at least bachelor's degree education in the United States with a correlation coefficient (R) of 0.063 and weighted average of 38.8%, a difference of 2.2%.
Bachelor's Degree Correlation Summary
| Measurement | Bermudan | Canadian |
| Minimum | 2.7% | 3.4% |
| Maximum | 77.3% | 76.9% |
| Range | 74.5% | 73.5% |
| Mean | 36.6% | 33.5% |
| Median | 37.7% | 33.0% |
| Interquartile 25% (IQ1) | 27.0% | 24.5% |
| Interquartile 75% (IQ3) | 42.7% | 41.3% |
| Interquartile Range (IQR) | 15.7% | 16.8% |
| Standard Deviation (Sample) | 16.3% | 14.5% |
| Standard Deviation (Population) | 16.1% | 14.3% |
Demographics Similar to Bermudans and Canadians by Bachelor's Degree
In terms of bachelor's degree, the demographic groups most similar to Bermudans are Czech (38.0%, a difference of 0.010%), Ghanaian (38.0%, a difference of 0.11%), Immigrants from Somalia (37.9%, a difference of 0.14%), Danish (38.1%, a difference of 0.20%), and Scottish (38.1%, a difference of 0.23%). Similarly, the demographic groups most similar to Canadians are Slavic (38.9%, a difference of 0.12%), Immigrants from Kenya (38.8%, a difference of 0.15%), Sudanese (38.9%, a difference of 0.18%), Kenyan (38.7%, a difference of 0.31%), and Immigrants from South America (38.6%, a difference of 0.59%).
| Demographics | Rating | Rank | Bachelor's Degree |
| Sudanese | 76.4 /100 | #152 | Good 38.9% |
| Slavs | 75.9 /100 | #153 | Good 38.9% |
| Canadians | 75.0 /100 | #154 | Good 38.8% |
| Immigrants | Kenya | 73.8 /100 | #155 | Good 38.8% |
| Kenyans | 72.5 /100 | #156 | Good 38.7% |
| Immigrants | South America | 70.1 /100 | #157 | Good 38.6% |
| Immigrants | Germany | 69.6 /100 | #158 | Good 38.6% |
| Chinese | 66.6 /100 | #159 | Good 38.5% |
| Vietnamese | 66.6 /100 | #160 | Good 38.5% |
| Uruguayans | 65.8 /100 | #161 | Good 38.4% |
| Colombians | 65.0 /100 | #162 | Good 38.4% |
| Peruvians | 63.4 /100 | #163 | Good 38.3% |
| Hungarians | 62.1 /100 | #164 | Good 38.3% |
| Sri Lankans | 59.1 /100 | #165 | Average 38.2% |
| Somalis | 58.6 /100 | #166 | Average 38.1% |
| Scottish | 56.6 /100 | #167 | Average 38.1% |
| Danes | 56.2 /100 | #168 | Average 38.1% |
| Ghanaians | 55.3 /100 | #169 | Average 38.0% |
| Czechs | 54.4 /100 | #170 | Average 38.0% |
| Bermudans | 54.2 /100 | #171 | Average 38.0% |
| Immigrants | Somalia | 52.8 /100 | #172 | Average 37.9% |