Arapaho vs Canadian Cognitive Disability
COMPARE
Arapaho
Canadian
Cognitive Disability
Cognitive Disability Comparison
Arapaho
Canadians
16.8%
COGNITIVE DISABILITY
97.3/ 100
METRIC RATING
110th/ 347
METRIC RANK
16.8%
COGNITIVE DISABILITY
97.5/ 100
METRIC RATING
108th/ 347
METRIC RANK
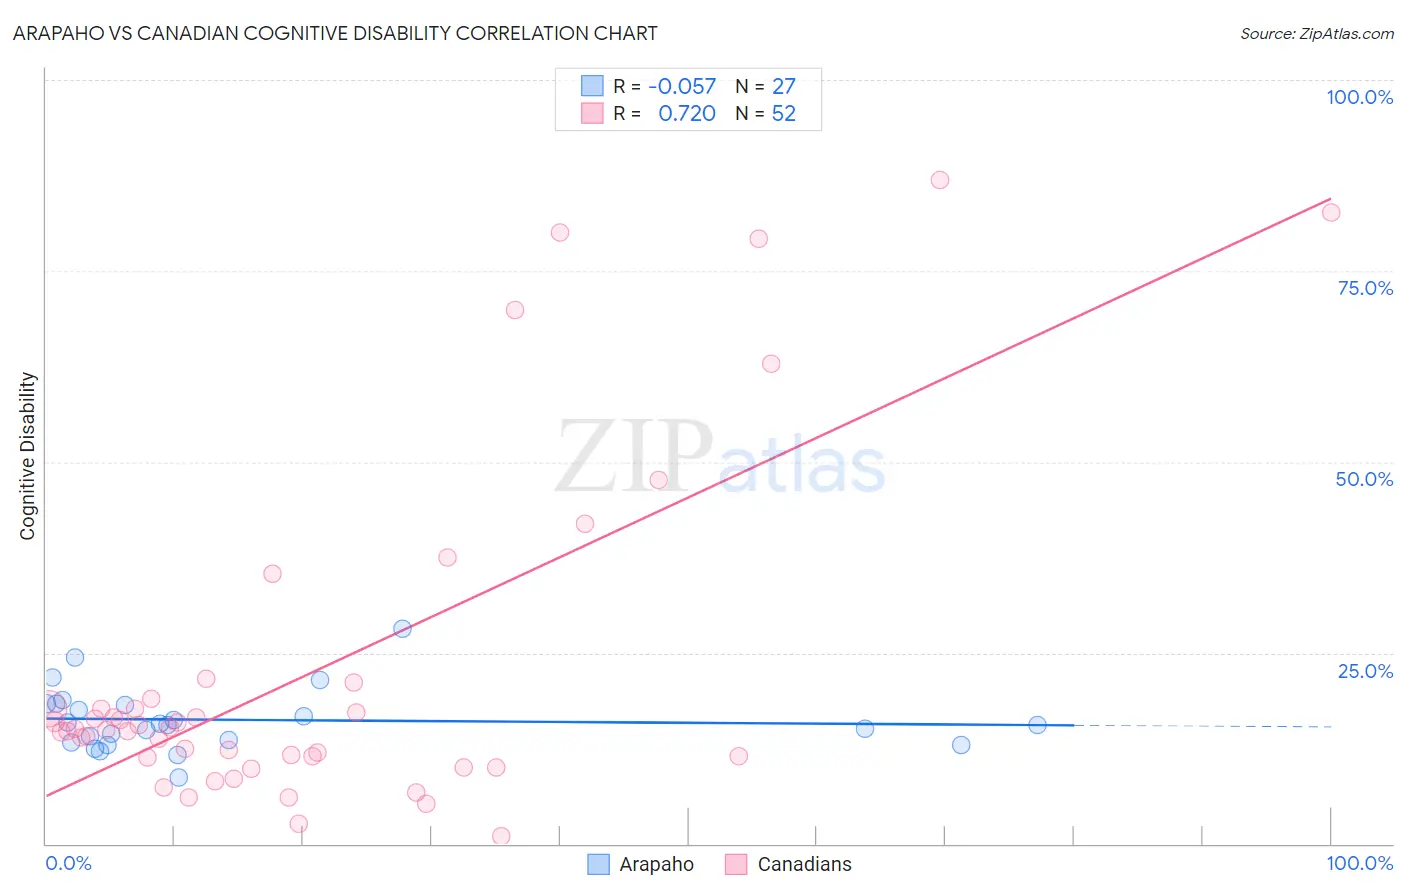
Arapaho vs Canadian Cognitive Disability Correlation Chart
The statistical analysis conducted on geographies consisting of 29,780,325 people shows a slight negative correlation between the proportion of Arapaho and percentage of population with cognitive disability in the United States with a correlation coefficient (R) of -0.057 and weighted average of 16.8%. Similarly, the statistical analysis conducted on geographies consisting of 437,506,516 people shows a strong positive correlation between the proportion of Canadians and percentage of population with cognitive disability in the United States with a correlation coefficient (R) of 0.720 and weighted average of 16.8%, a difference of 0.060%.
Cognitive Disability Correlation Summary
| Measurement | Arapaho | Canadian |
| Minimum | 8.6% | 1.0% |
| Maximum | 28.2% | 87.0% |
| Range | 19.5% | 85.9% |
| Mean | 16.2% | 22.4% |
| Median | 15.6% | 15.0% |
| Interquartile 25% (IQ1) | 13.2% | 11.3% |
| Interquartile 75% (IQ3) | 18.3% | 18.4% |
| Interquartile Range (IQR) | 5.0% | 7.1% |
| Standard Deviation (Sample) | 4.1% | 21.9% |
| Standard Deviation (Population) | 4.1% | 21.7% |
Demographics Similar to Arapaho and Canadians by Cognitive Disability
In terms of cognitive disability, the demographic groups most similar to Arapaho are Albanian (16.8%, a difference of 0.010%), Uruguayan (16.8%, a difference of 0.010%), Indian (Asian) (16.8%, a difference of 0.040%), Immigrants from Sri Lanka (16.8%, a difference of 0.040%), and Korean (16.8%, a difference of 0.040%). Similarly, the demographic groups most similar to Canadians are Albanian (16.8%, a difference of 0.050%), Uruguayan (16.8%, a difference of 0.070%), Immigrants from Nicaragua (16.8%, a difference of 0.090%), Indian (Asian) (16.8%, a difference of 0.090%), and Immigrants from Sri Lanka (16.8%, a difference of 0.090%).
| Demographics | Rating | Rank | Cognitive Disability |
| Jordanians | 98.2 /100 | #99 | Exceptional 16.8% |
| Immigrants | Russia | 98.2 /100 | #100 | Exceptional 16.8% |
| Immigrants | Asia | 98.1 /100 | #101 | Exceptional 16.8% |
| Irish | 98.1 /100 | #102 | Exceptional 16.8% |
| Paraguayans | 98.0 /100 | #103 | Exceptional 16.8% |
| Palestinians | 98.0 /100 | #104 | Exceptional 16.8% |
| Immigrants | Eastern Asia | 97.9 /100 | #105 | Exceptional 16.8% |
| Northern Europeans | 97.8 /100 | #106 | Exceptional 16.8% |
| Immigrants | Nicaragua | 97.8 /100 | #107 | Exceptional 16.8% |
| Canadians | 97.5 /100 | #108 | Exceptional 16.8% |
| Albanians | 97.3 /100 | #109 | Exceptional 16.8% |
| Arapaho | 97.3 /100 | #110 | Exceptional 16.8% |
| Uruguayans | 97.2 /100 | #111 | Exceptional 16.8% |
| Indians (Asian) | 97.2 /100 | #112 | Exceptional 16.8% |
| Immigrants | Sri Lanka | 97.1 /100 | #113 | Exceptional 16.8% |
| Koreans | 97.1 /100 | #114 | Exceptional 16.8% |
| Yup'ik | 96.9 /100 | #115 | Exceptional 16.9% |
| Inupiat | 96.5 /100 | #116 | Exceptional 16.9% |
| Immigrants | Japan | 96.2 /100 | #117 | Exceptional 16.9% |
| Immigrants | Denmark | 96.2 /100 | #118 | Exceptional 16.9% |
| South Africans | 95.5 /100 | #119 | Exceptional 16.9% |