Bulgarian vs Immigrants from Spain High School Diploma
COMPARE
Bulgarian
Immigrants from Spain
High School Diploma
High School Diploma Comparison
Bulgarians
Immigrants from Spain
91.8%
HIGH SCHOOL DIPLOMA
100.0/ 100
METRIC RATING
14th/ 347
METRIC RANK
89.5%
HIGH SCHOOL DIPLOMA
76.2/ 100
METRIC RATING
146th/ 347
METRIC RANK
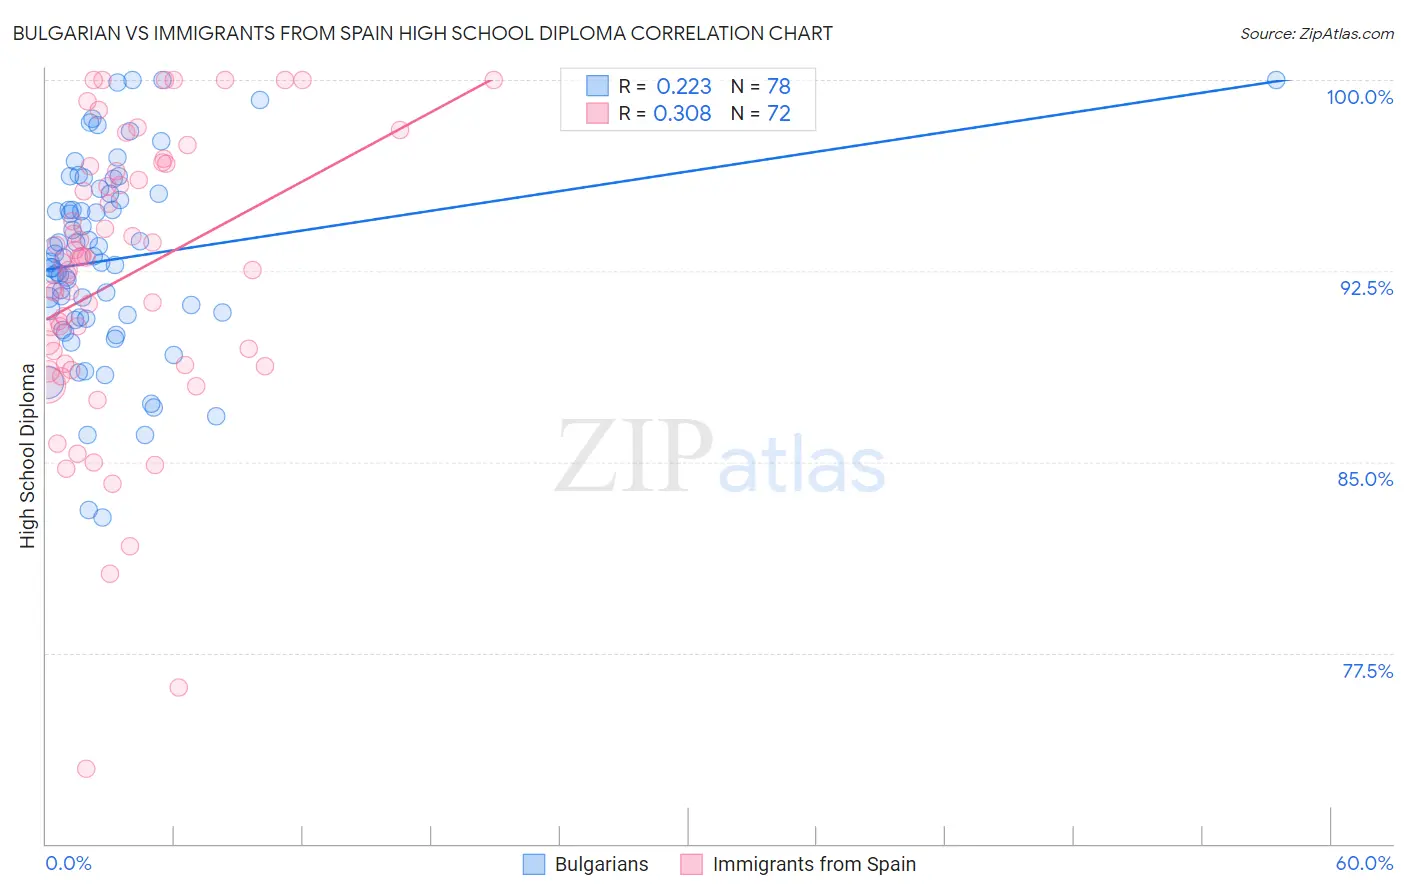
Bulgarian vs Immigrants from Spain High School Diploma Correlation Chart
The statistical analysis conducted on geographies consisting of 205,633,404 people shows a weak positive correlation between the proportion of Bulgarians and percentage of population with at least high school diploma education in the United States with a correlation coefficient (R) of 0.223 and weighted average of 91.8%. Similarly, the statistical analysis conducted on geographies consisting of 239,682,725 people shows a mild positive correlation between the proportion of Immigrants from Spain and percentage of population with at least high school diploma education in the United States with a correlation coefficient (R) of 0.308 and weighted average of 89.5%, a difference of 2.5%.
High School Diploma Correlation Summary
| Measurement | Bulgarian | Immigrants from Spain |
| Minimum | 82.8% | 72.9% |
| Maximum | 100.0% | 100.0% |
| Range | 17.2% | 27.1% |
| Mean | 93.0% | 92.2% |
| Median | 92.9% | 92.9% |
| Interquartile 25% (IQ1) | 90.7% | 88.8% |
| Interquartile 75% (IQ3) | 95.5% | 96.5% |
| Interquartile Range (IQR) | 4.9% | 7.7% |
| Standard Deviation (Sample) | 3.8% | 5.6% |
| Standard Deviation (Population) | 3.7% | 5.6% |
Similar Demographics by High School Diploma
Demographics Similar to Bulgarians by High School Diploma
In terms of high school diploma, the demographic groups most similar to Bulgarians are Luxembourger (91.7%, a difference of 0.030%), Danish (91.8%, a difference of 0.050%), Finnish (91.7%, a difference of 0.050%), Immigrants from Singapore (91.7%, a difference of 0.090%), and Polish (91.9%, a difference of 0.10%).
| Demographics | Rating | Rank | High School Diploma |
| Immigrants | India | 100.0 /100 | #7 | Exceptional 92.0% |
| Chinese | 100.0 /100 | #8 | Exceptional 92.0% |
| Latvians | 100.0 /100 | #9 | Exceptional 92.0% |
| Croatians | 100.0 /100 | #10 | Exceptional 92.0% |
| Eastern Europeans | 100.0 /100 | #11 | Exceptional 91.9% |
| Poles | 100.0 /100 | #12 | Exceptional 91.9% |
| Danes | 100.0 /100 | #13 | Exceptional 91.8% |
| Bulgarians | 100.0 /100 | #14 | Exceptional 91.8% |
| Luxembourgers | 100.0 /100 | #15 | Exceptional 91.7% |
| Finns | 100.0 /100 | #16 | Exceptional 91.7% |
| Immigrants | Singapore | 99.9 /100 | #17 | Exceptional 91.7% |
| Germans | 99.9 /100 | #18 | Exceptional 91.7% |
| Maltese | 99.9 /100 | #19 | Exceptional 91.6% |
| Czechs | 99.9 /100 | #20 | Exceptional 91.6% |
| Filipinos | 99.9 /100 | #21 | Exceptional 91.6% |
Demographics Similar to Immigrants from Spain by High School Diploma
In terms of high school diploma, the demographic groups most similar to Immigrants from Spain are Immigrants from Brazil (89.5%, a difference of 0.010%), Immigrants from Kenya (89.6%, a difference of 0.040%), Pakistani (89.6%, a difference of 0.050%), Iraqi (89.5%, a difference of 0.050%), and Chilean (89.6%, a difference of 0.060%).
| Demographics | Rating | Rank | High School Diploma |
| Kenyans | 81.4 /100 | #139 | Excellent 89.6% |
| Immigrants | Egypt | 81.2 /100 | #140 | Excellent 89.6% |
| Chileans | 79.0 /100 | #141 | Good 89.6% |
| Indians (Asian) | 78.8 /100 | #142 | Good 89.6% |
| Pakistanis | 78.3 /100 | #143 | Good 89.6% |
| Immigrants | Kenya | 78.0 /100 | #144 | Good 89.6% |
| Immigrants | Brazil | 76.6 /100 | #145 | Good 89.5% |
| Immigrants | Spain | 76.2 /100 | #146 | Good 89.5% |
| Iraqis | 73.9 /100 | #147 | Good 89.5% |
| Immigrants | Lebanon | 73.4 /100 | #148 | Good 89.5% |
| Immigrants | Poland | 72.9 /100 | #149 | Good 89.5% |
| Argentineans | 72.3 /100 | #150 | Good 89.5% |
| Paraguayans | 71.4 /100 | #151 | Good 89.5% |
| Asians | 70.7 /100 | #152 | Good 89.4% |
| Immigrants | Iraq | 68.7 /100 | #153 | Good 89.4% |