Shoshone vs Immigrants from Norway High School Diploma
COMPARE
Shoshone
Immigrants from Norway
High School Diploma
High School Diploma Comparison
Shoshone
Immigrants from Norway
88.3%
HIGH SCHOOL DIPLOMA
7.0/ 100
METRIC RATING
224th/ 347
METRIC RANK
90.5%
HIGH SCHOOL DIPLOMA
98.0/ 100
METRIC RATING
101st/ 347
METRIC RANK
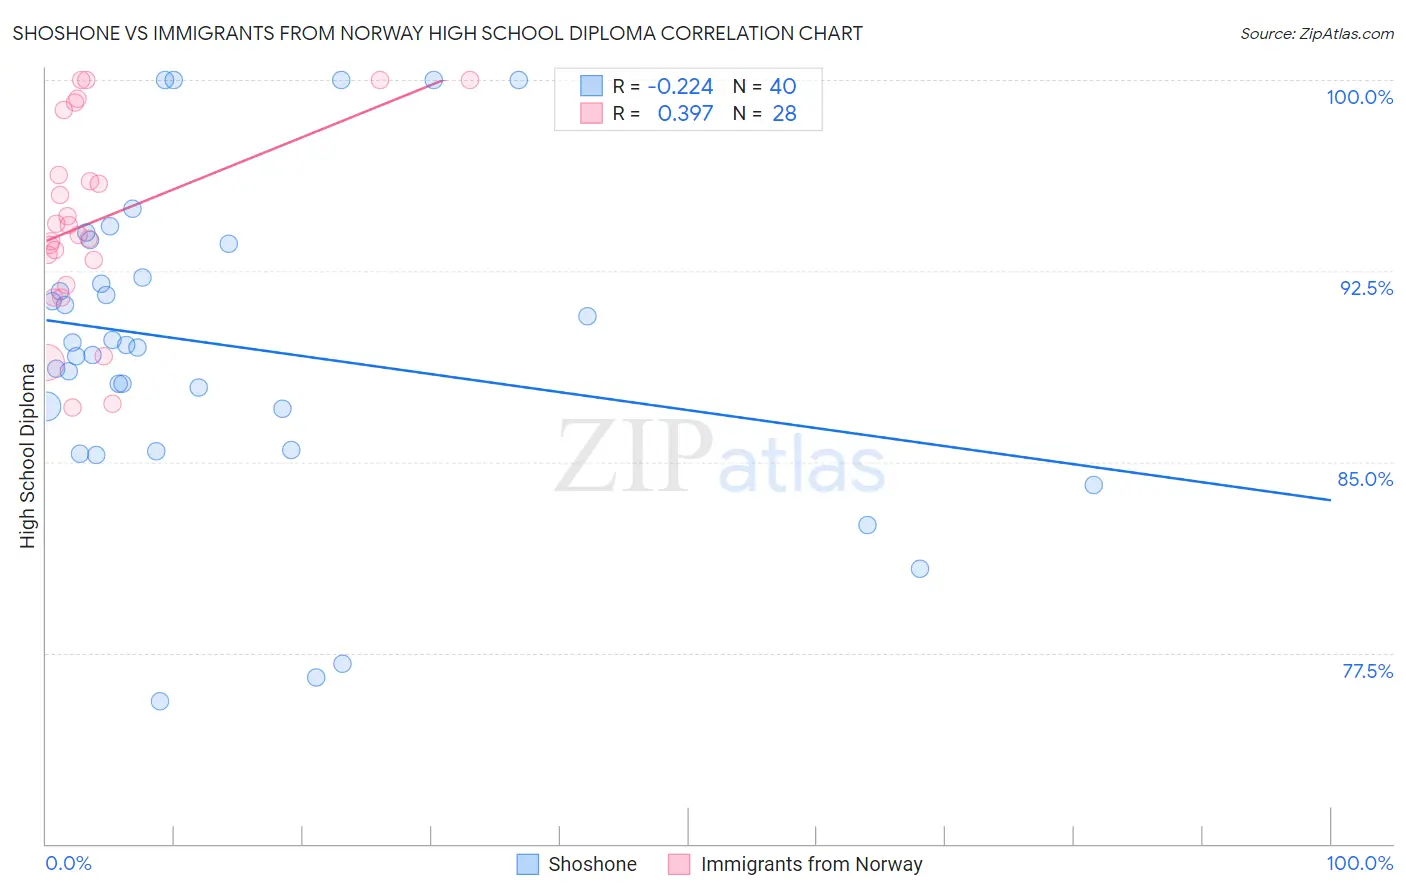
Shoshone vs Immigrants from Norway High School Diploma Correlation Chart
The statistical analysis conducted on geographies consisting of 66,627,351 people shows a weak negative correlation between the proportion of Shoshone and percentage of population with at least high school diploma education in the United States with a correlation coefficient (R) of -0.224 and weighted average of 88.3%. Similarly, the statistical analysis conducted on geographies consisting of 116,716,356 people shows a mild positive correlation between the proportion of Immigrants from Norway and percentage of population with at least high school diploma education in the United States with a correlation coefficient (R) of 0.397 and weighted average of 90.5%, a difference of 2.5%.
High School Diploma Correlation Summary
| Measurement | Shoshone | Immigrants from Norway |
| Minimum | 75.6% | 87.1% |
| Maximum | 100.0% | 100.0% |
| Range | 24.4% | 12.9% |
| Mean | 89.5% | 94.5% |
| Median | 89.5% | 94.1% |
| Interquartile 25% (IQ1) | 86.3% | 92.4% |
| Interquartile 75% (IQ3) | 92.9% | 97.5% |
| Interquartile Range (IQR) | 6.6% | 5.1% |
| Standard Deviation (Sample) | 6.1% | 3.8% |
| Standard Deviation (Population) | 6.0% | 3.7% |
Similar Demographics by High School Diploma
Demographics Similar to Shoshone by High School Diploma
In terms of high school diploma, the demographic groups most similar to Shoshone are Creek (88.3%, a difference of 0.010%), Colville (88.3%, a difference of 0.040%), Immigrants from Zaire (88.3%, a difference of 0.040%), Immigrants from Afghanistan (88.3%, a difference of 0.090%), and Uruguayan (88.2%, a difference of 0.090%).
| Demographics | Rating | Rank | High School Diploma |
| Immigrants | Africa | 10.6 /100 | #217 | Poor 88.4% |
| Immigrants | Bolivia | 10.3 /100 | #218 | Poor 88.4% |
| Costa Ricans | 9.6 /100 | #219 | Tragic 88.4% |
| Tongans | 9.5 /100 | #220 | Tragic 88.4% |
| Immigrants | Afghanistan | 8.6 /100 | #221 | Tragic 88.3% |
| Colville | 7.8 /100 | #222 | Tragic 88.3% |
| Immigrants | Zaire | 7.6 /100 | #223 | Tragic 88.3% |
| Shoshone | 7.0 /100 | #224 | Tragic 88.3% |
| Creek | 6.9 /100 | #225 | Tragic 88.3% |
| Uruguayans | 5.6 /100 | #226 | Tragic 88.2% |
| Immigrants | Liberia | 5.5 /100 | #227 | Tragic 88.2% |
| Kiowa | 5.3 /100 | #228 | Tragic 88.2% |
| Nigerians | 5.2 /100 | #229 | Tragic 88.2% |
| Blackfeet | 4.2 /100 | #230 | Tragic 88.1% |
| Colombians | 3.8 /100 | #231 | Tragic 88.1% |
Demographics Similar to Immigrants from Norway by High School Diploma
In terms of high school diploma, the demographic groups most similar to Immigrants from Norway are Aleut (90.4%, a difference of 0.010%), Immigrants from North Macedonia (90.5%, a difference of 0.020%), Immigrants from Europe (90.5%, a difference of 0.030%), Immigrants from Romania (90.4%, a difference of 0.030%), and Immigrants from Croatia (90.4%, a difference of 0.040%).
| Demographics | Rating | Rank | High School Diploma |
| Immigrants | Israel | 98.5 /100 | #94 | Exceptional 90.5% |
| Icelanders | 98.5 /100 | #95 | Exceptional 90.5% |
| Immigrants | Serbia | 98.4 /100 | #96 | Exceptional 90.5% |
| Immigrants | Kuwait | 98.3 /100 | #97 | Exceptional 90.5% |
| Immigrants | Korea | 98.3 /100 | #98 | Exceptional 90.5% |
| Immigrants | Europe | 98.2 /100 | #99 | Exceptional 90.5% |
| Immigrants | North Macedonia | 98.1 /100 | #100 | Exceptional 90.5% |
| Immigrants | Norway | 98.0 /100 | #101 | Exceptional 90.5% |
| Aleuts | 98.0 /100 | #102 | Exceptional 90.4% |
| Immigrants | Romania | 97.8 /100 | #103 | Exceptional 90.4% |
| Immigrants | Croatia | 97.8 /100 | #104 | Exceptional 90.4% |
| Lebanese | 97.4 /100 | #105 | Exceptional 90.4% |
| Syrians | 97.0 /100 | #106 | Exceptional 90.3% |
| Immigrants | Russia | 96.9 /100 | #107 | Exceptional 90.3% |
| Palestinians | 96.7 /100 | #108 | Exceptional 90.3% |