Immigrants from Cambodia vs Immigrants from Norway High School Diploma
COMPARE
Immigrants from Cambodia
Immigrants from Norway
High School Diploma
High School Diploma Comparison
Immigrants from Cambodia
Immigrants from Norway
85.6%
HIGH SCHOOL DIPLOMA
0.0/ 100
METRIC RATING
296th/ 347
METRIC RANK
90.5%
HIGH SCHOOL DIPLOMA
98.0/ 100
METRIC RATING
101st/ 347
METRIC RANK
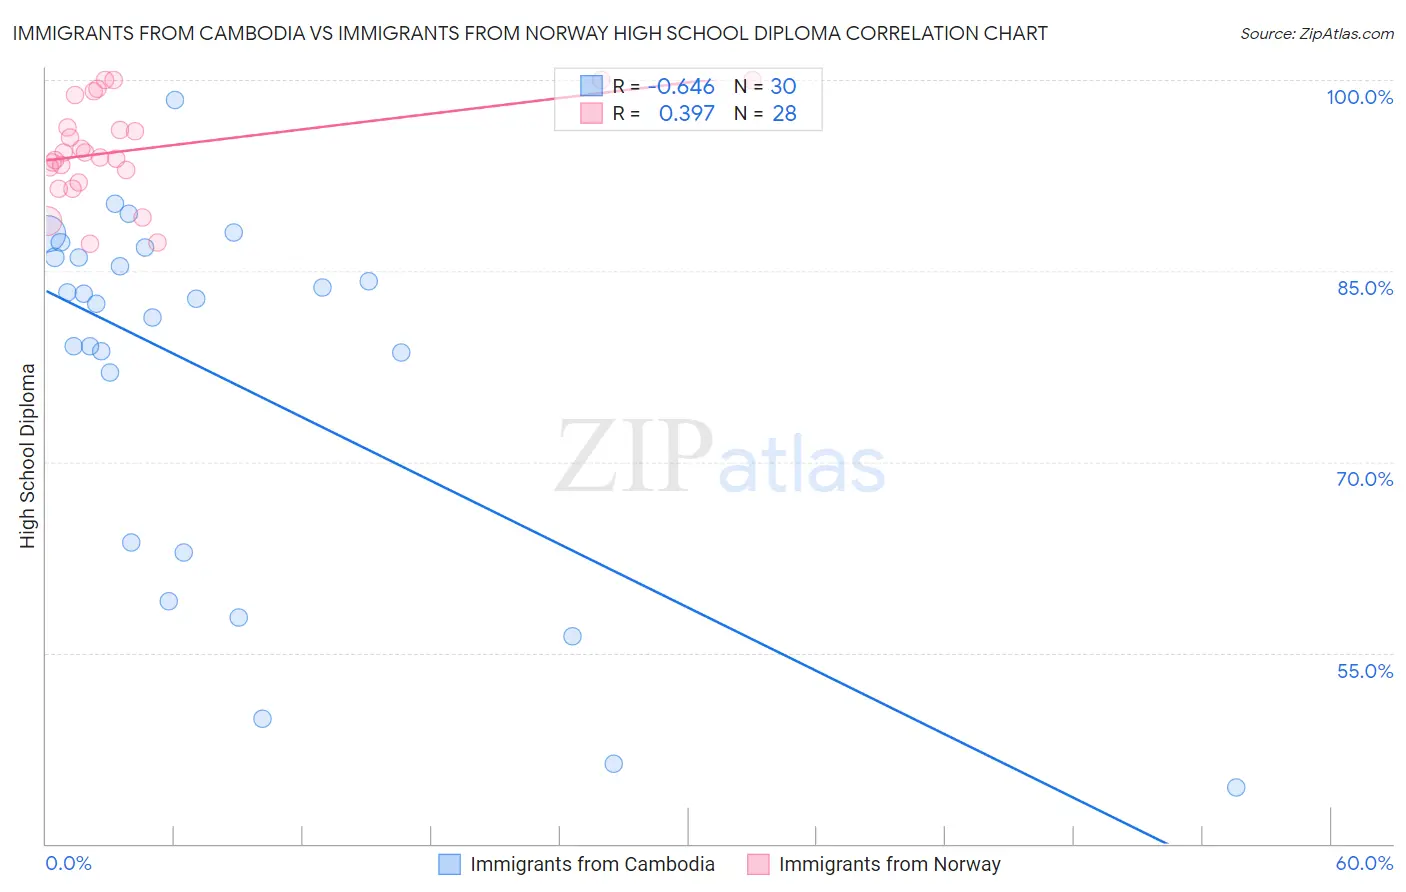
Immigrants from Cambodia vs Immigrants from Norway High School Diploma Correlation Chart
The statistical analysis conducted on geographies consisting of 205,153,442 people shows a significant negative correlation between the proportion of Immigrants from Cambodia and percentage of population with at least high school diploma education in the United States with a correlation coefficient (R) of -0.646 and weighted average of 85.6%. Similarly, the statistical analysis conducted on geographies consisting of 116,716,356 people shows a mild positive correlation between the proportion of Immigrants from Norway and percentage of population with at least high school diploma education in the United States with a correlation coefficient (R) of 0.397 and weighted average of 90.5%, a difference of 5.6%.
High School Diploma Correlation Summary
| Measurement | Immigrants from Cambodia | Immigrants from Norway |
| Minimum | 44.4% | 87.1% |
| Maximum | 98.4% | 100.0% |
| Range | 54.0% | 12.9% |
| Mean | 76.7% | 94.5% |
| Median | 82.6% | 94.1% |
| Interquartile 25% (IQ1) | 63.7% | 92.4% |
| Interquartile 75% (IQ3) | 86.1% | 97.5% |
| Interquartile Range (IQR) | 22.4% | 5.1% |
| Standard Deviation (Sample) | 14.4% | 3.8% |
| Standard Deviation (Population) | 14.1% | 3.7% |
Similar Demographics by High School Diploma
Demographics Similar to Immigrants from Cambodia by High School Diploma
In terms of high school diploma, the demographic groups most similar to Immigrants from Cambodia are Immigrants from Grenada (85.6%, a difference of 0.070%), Native/Alaskan (85.6%, a difference of 0.090%), Guyanese (85.5%, a difference of 0.18%), Immigrants (85.8%, a difference of 0.21%), and Immigrants from Bangladesh (85.5%, a difference of 0.21%).
| Demographics | Rating | Rank | High School Diploma |
| Yup'ik | 0.0 /100 | #289 | Tragic 86.1% |
| Fijians | 0.0 /100 | #290 | Tragic 86.0% |
| Haitians | 0.0 /100 | #291 | Tragic 85.9% |
| Japanese | 0.0 /100 | #292 | Tragic 85.9% |
| British West Indians | 0.0 /100 | #293 | Tragic 85.9% |
| Immigrants | Fiji | 0.0 /100 | #294 | Tragic 85.8% |
| Immigrants | Immigrants | 0.0 /100 | #295 | Tragic 85.8% |
| Immigrants | Cambodia | 0.0 /100 | #296 | Tragic 85.6% |
| Immigrants | Grenada | 0.0 /100 | #297 | Tragic 85.6% |
| Natives/Alaskans | 0.0 /100 | #298 | Tragic 85.6% |
| Guyanese | 0.0 /100 | #299 | Tragic 85.5% |
| Immigrants | Bangladesh | 0.0 /100 | #300 | Tragic 85.5% |
| Vietnamese | 0.0 /100 | #301 | Tragic 85.4% |
| Immigrants | Haiti | 0.0 /100 | #302 | Tragic 85.4% |
| Cubans | 0.0 /100 | #303 | Tragic 85.4% |
Demographics Similar to Immigrants from Norway by High School Diploma
In terms of high school diploma, the demographic groups most similar to Immigrants from Norway are Aleut (90.4%, a difference of 0.010%), Immigrants from North Macedonia (90.5%, a difference of 0.020%), Immigrants from Europe (90.5%, a difference of 0.030%), Immigrants from Romania (90.4%, a difference of 0.030%), and Immigrants from Croatia (90.4%, a difference of 0.040%).
| Demographics | Rating | Rank | High School Diploma |
| Immigrants | Israel | 98.5 /100 | #94 | Exceptional 90.5% |
| Icelanders | 98.5 /100 | #95 | Exceptional 90.5% |
| Immigrants | Serbia | 98.4 /100 | #96 | Exceptional 90.5% |
| Immigrants | Kuwait | 98.3 /100 | #97 | Exceptional 90.5% |
| Immigrants | Korea | 98.3 /100 | #98 | Exceptional 90.5% |
| Immigrants | Europe | 98.2 /100 | #99 | Exceptional 90.5% |
| Immigrants | North Macedonia | 98.1 /100 | #100 | Exceptional 90.5% |
| Immigrants | Norway | 98.0 /100 | #101 | Exceptional 90.5% |
| Aleuts | 98.0 /100 | #102 | Exceptional 90.4% |
| Immigrants | Romania | 97.8 /100 | #103 | Exceptional 90.4% |
| Immigrants | Croatia | 97.8 /100 | #104 | Exceptional 90.4% |
| Lebanese | 97.4 /100 | #105 | Exceptional 90.4% |
| Syrians | 97.0 /100 | #106 | Exceptional 90.3% |
| Immigrants | Russia | 96.9 /100 | #107 | Exceptional 90.3% |
| Palestinians | 96.7 /100 | #108 | Exceptional 90.3% |