Apache vs Immigrants from Uruguay No Schooling Completed
COMPARE
Apache
Immigrants from Uruguay
No Schooling Completed
No Schooling Completed Comparison
Apache
Immigrants from Uruguay
2.1%
NO SCHOOLING COMPLETED
56.7/ 100
METRIC RATING
169th/ 347
METRIC RANK
2.3%
NO SCHOOLING COMPLETED
3.4/ 100
METRIC RATING
231st/ 347
METRIC RANK
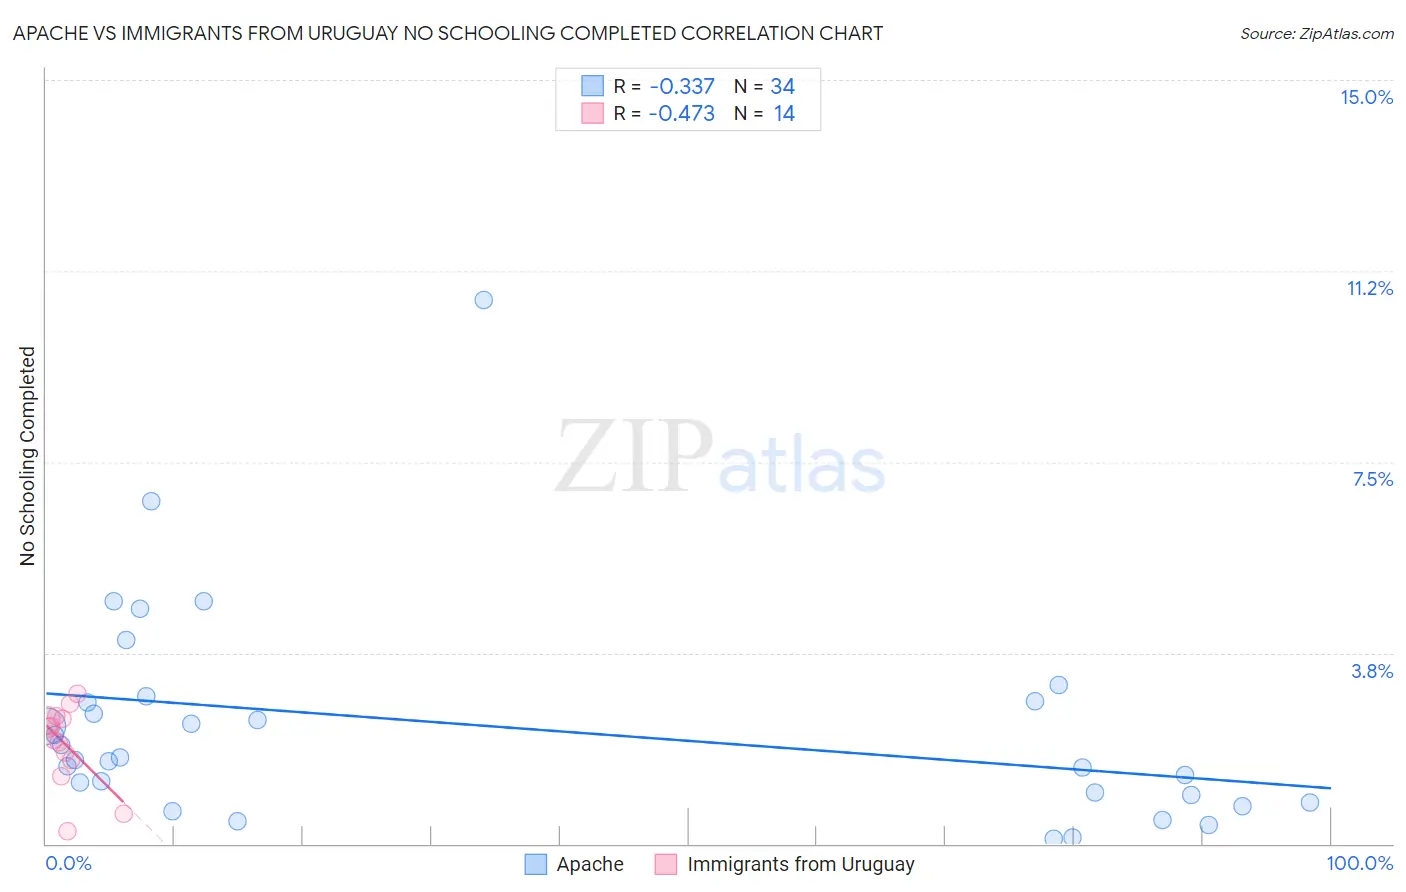
Apache vs Immigrants from Uruguay No Schooling Completed Correlation Chart
The statistical analysis conducted on geographies consisting of 229,858,613 people shows a mild negative correlation between the proportion of Apache and percentage of population with no schooling in the United States with a correlation coefficient (R) of -0.337 and weighted average of 2.1%. Similarly, the statistical analysis conducted on geographies consisting of 132,928,129 people shows a moderate negative correlation between the proportion of Immigrants from Uruguay and percentage of population with no schooling in the United States with a correlation coefficient (R) of -0.473 and weighted average of 2.3%, a difference of 12.2%.
No Schooling Completed Correlation Summary
| Measurement | Apache | Immigrants from Uruguay |
| Minimum | 0.098% | 0.24% |
| Maximum | 10.7% | 2.9% |
| Range | 10.6% | 2.7% |
| Mean | 2.3% | 2.0% |
| Median | 1.7% | 2.2% |
| Interquartile 25% (IQ1) | 0.95% | 1.7% |
| Interquartile 75% (IQ3) | 2.8% | 2.5% |
| Interquartile Range (IQR) | 1.9% | 0.80% |
| Standard Deviation (Sample) | 2.1% | 0.78% |
| Standard Deviation (Population) | 2.1% | 0.75% |
Similar Demographics by No Schooling Completed
Demographics Similar to Apache by No Schooling Completed
In terms of no schooling completed, the demographic groups most similar to Apache are Argentinean (2.1%, a difference of 0.090%), Immigrants from Poland (2.1%, a difference of 0.20%), Cheyenne (2.1%, a difference of 0.27%), Egyptian (2.1%, a difference of 0.35%), and Dutch West Indian (2.1%, a difference of 0.46%).
| Demographics | Rating | Rank | No Schooling Completed |
| Immigrants | Brazil | 63.8 /100 | #162 | Good 2.1% |
| Albanians | 62.2 /100 | #163 | Good 2.1% |
| Comanche | 60.7 /100 | #164 | Good 2.1% |
| Brazilians | 60.2 /100 | #165 | Good 2.1% |
| Dutch West Indians | 59.9 /100 | #166 | Average 2.1% |
| Egyptians | 59.2 /100 | #167 | Average 2.1% |
| Cheyenne | 58.6 /100 | #168 | Average 2.1% |
| Apache | 56.7 /100 | #169 | Average 2.1% |
| Argentineans | 56.0 /100 | #170 | Average 2.1% |
| Immigrants | Poland | 55.2 /100 | #171 | Average 2.1% |
| Immigrants | Argentina | 52.7 /100 | #172 | Average 2.1% |
| Immigrants | Belarus | 51.8 /100 | #173 | Average 2.1% |
| Immigrants | Micronesia | 50.0 /100 | #174 | Average 2.1% |
| Arabs | 46.4 /100 | #175 | Average 2.1% |
| Panamanians | 45.2 /100 | #176 | Average 2.1% |
Demographics Similar to Immigrants from Uruguay by No Schooling Completed
In terms of no schooling completed, the demographic groups most similar to Immigrants from Uruguay are Puerto Rican (2.3%, a difference of 0.020%), Immigrants from Pakistan (2.3%, a difference of 0.16%), Colombian (2.3%, a difference of 0.22%), U.S. Virgin Islander (2.3%, a difference of 0.24%), and Immigrants from Uganda (2.3%, a difference of 0.53%).
| Demographics | Rating | Rank | No Schooling Completed |
| Tohono O'odham | 4.1 /100 | #224 | Tragic 2.3% |
| Sudanese | 4.1 /100 | #225 | Tragic 2.3% |
| Sierra Leoneans | 4.1 /100 | #226 | Tragic 2.3% |
| Immigrants | Uganda | 4.0 /100 | #227 | Tragic 2.3% |
| U.S. Virgin Islanders | 3.7 /100 | #228 | Tragic 2.3% |
| Immigrants | Pakistan | 3.6 /100 | #229 | Tragic 2.3% |
| Puerto Ricans | 3.4 /100 | #230 | Tragic 2.3% |
| Immigrants | Uruguay | 3.4 /100 | #231 | Tragic 2.3% |
| Colombians | 3.2 /100 | #232 | Tragic 2.3% |
| Immigrants | Malaysia | 2.8 /100 | #233 | Tragic 2.3% |
| Nigerians | 2.6 /100 | #234 | Tragic 2.3% |
| Immigrants | Western Asia | 2.6 /100 | #235 | Tragic 2.3% |
| Iraqis | 2.2 /100 | #236 | Tragic 2.4% |
| Immigrants | Eastern Asia | 2.0 /100 | #237 | Tragic 2.4% |
| Paiute | 1.9 /100 | #238 | Tragic 2.4% |