Apache vs Immigrants from Cuba No Schooling Completed
COMPARE
Apache
Immigrants from Cuba
No Schooling Completed
No Schooling Completed Comparison
Apache
Immigrants from Cuba
2.1%
NO SCHOOLING COMPLETED
56.7/ 100
METRIC RATING
169th/ 347
METRIC RANK
2.8%
NO SCHOOLING COMPLETED
0.0/ 100
METRIC RATING
297th/ 347
METRIC RANK
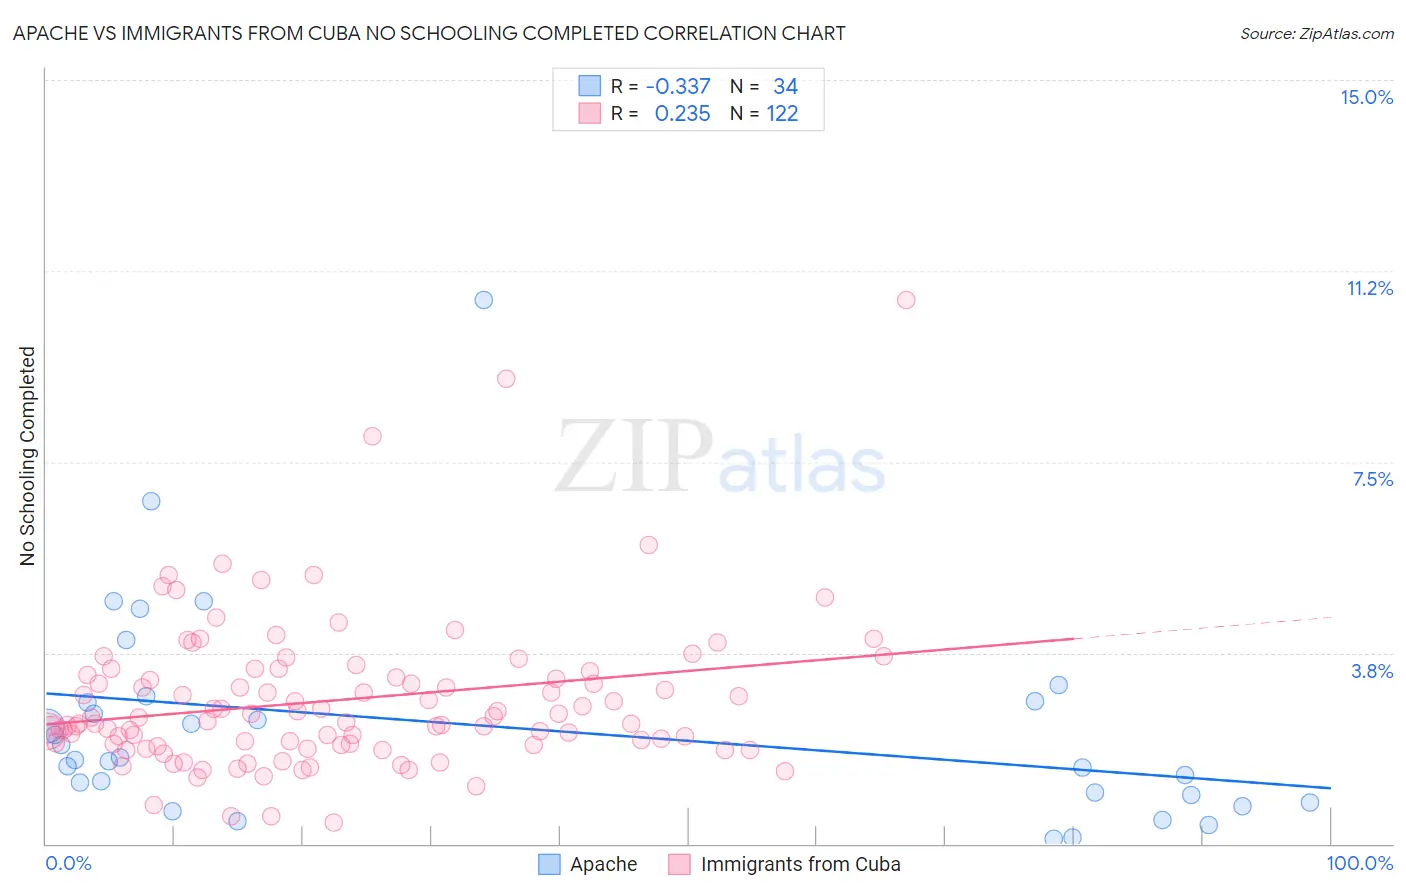
Apache vs Immigrants from Cuba No Schooling Completed Correlation Chart
The statistical analysis conducted on geographies consisting of 229,858,613 people shows a mild negative correlation between the proportion of Apache and percentage of population with no schooling in the United States with a correlation coefficient (R) of -0.337 and weighted average of 2.1%. Similarly, the statistical analysis conducted on geographies consisting of 324,009,430 people shows a weak positive correlation between the proportion of Immigrants from Cuba and percentage of population with no schooling in the United States with a correlation coefficient (R) of 0.235 and weighted average of 2.8%, a difference of 36.1%.
No Schooling Completed Correlation Summary
| Measurement | Apache | Immigrants from Cuba |
| Minimum | 0.098% | 0.42% |
| Maximum | 10.7% | 10.7% |
| Range | 10.6% | 10.3% |
| Mean | 2.3% | 2.8% |
| Median | 1.7% | 2.5% |
| Interquartile 25% (IQ1) | 0.95% | 2.0% |
| Interquartile 75% (IQ3) | 2.8% | 3.3% |
| Interquartile Range (IQR) | 1.9% | 1.4% |
| Standard Deviation (Sample) | 2.1% | 1.5% |
| Standard Deviation (Population) | 2.1% | 1.5% |
Similar Demographics by No Schooling Completed
Demographics Similar to Apache by No Schooling Completed
In terms of no schooling completed, the demographic groups most similar to Apache are Argentinean (2.1%, a difference of 0.090%), Immigrants from Poland (2.1%, a difference of 0.20%), Cheyenne (2.1%, a difference of 0.27%), Egyptian (2.1%, a difference of 0.35%), and Dutch West Indian (2.1%, a difference of 0.46%).
| Demographics | Rating | Rank | No Schooling Completed |
| Immigrants | Brazil | 63.8 /100 | #162 | Good 2.1% |
| Albanians | 62.2 /100 | #163 | Good 2.1% |
| Comanche | 60.7 /100 | #164 | Good 2.1% |
| Brazilians | 60.2 /100 | #165 | Good 2.1% |
| Dutch West Indians | 59.9 /100 | #166 | Average 2.1% |
| Egyptians | 59.2 /100 | #167 | Average 2.1% |
| Cheyenne | 58.6 /100 | #168 | Average 2.1% |
| Apache | 56.7 /100 | #169 | Average 2.1% |
| Argentineans | 56.0 /100 | #170 | Average 2.1% |
| Immigrants | Poland | 55.2 /100 | #171 | Average 2.1% |
| Immigrants | Argentina | 52.7 /100 | #172 | Average 2.1% |
| Immigrants | Belarus | 51.8 /100 | #173 | Average 2.1% |
| Immigrants | Micronesia | 50.0 /100 | #174 | Average 2.1% |
| Arabs | 46.4 /100 | #175 | Average 2.1% |
| Panamanians | 45.2 /100 | #176 | Average 2.1% |
Demographics Similar to Immigrants from Cuba by No Schooling Completed
In terms of no schooling completed, the demographic groups most similar to Immigrants from Cuba are Immigrants from Dominica (2.8%, a difference of 0.33%), Central American Indian (2.8%, a difference of 0.84%), Immigrants (2.8%, a difference of 1.1%), Haitian (2.9%, a difference of 1.2%), and Houma (2.8%, a difference of 1.3%).
| Demographics | Rating | Rank | No Schooling Completed |
| Immigrants | Hong Kong | 0.0 /100 | #290 | Tragic 2.7% |
| British West Indians | 0.0 /100 | #291 | Tragic 2.7% |
| Immigrants | Grenada | 0.0 /100 | #292 | Tragic 2.8% |
| Malaysians | 0.0 /100 | #293 | Tragic 2.8% |
| Immigrants | Eritrea | 0.0 /100 | #294 | Tragic 2.8% |
| Houma | 0.0 /100 | #295 | Tragic 2.8% |
| Immigrants | Immigrants | 0.0 /100 | #296 | Tragic 2.8% |
| Immigrants | Cuba | 0.0 /100 | #297 | Tragic 2.8% |
| Immigrants | Dominica | 0.0 /100 | #298 | Tragic 2.8% |
| Central American Indians | 0.0 /100 | #299 | Tragic 2.8% |
| Haitians | 0.0 /100 | #300 | Tragic 2.9% |
| Immigrants | South Eastern Asia | 0.0 /100 | #301 | Tragic 2.9% |
| Immigrants | Caribbean | 0.0 /100 | #302 | Tragic 2.9% |
| Somalis | 0.0 /100 | #303 | Tragic 2.9% |
| Nicaraguans | 0.0 /100 | #304 | Tragic 2.9% |