Guamanian/Chamorro vs Immigrants from Greece No Schooling Completed
COMPARE
Guamanian/Chamorro
Immigrants from Greece
No Schooling Completed
No Schooling Completed Comparison
Guamanians/Chamorros
Immigrants from Greece
2.2%
NO SCHOOLING COMPLETED
29.8/ 100
METRIC RATING
192nd/ 347
METRIC RANK
2.0%
NO SCHOOLING COMPLETED
83.5/ 100
METRIC RATING
141st/ 347
METRIC RANK
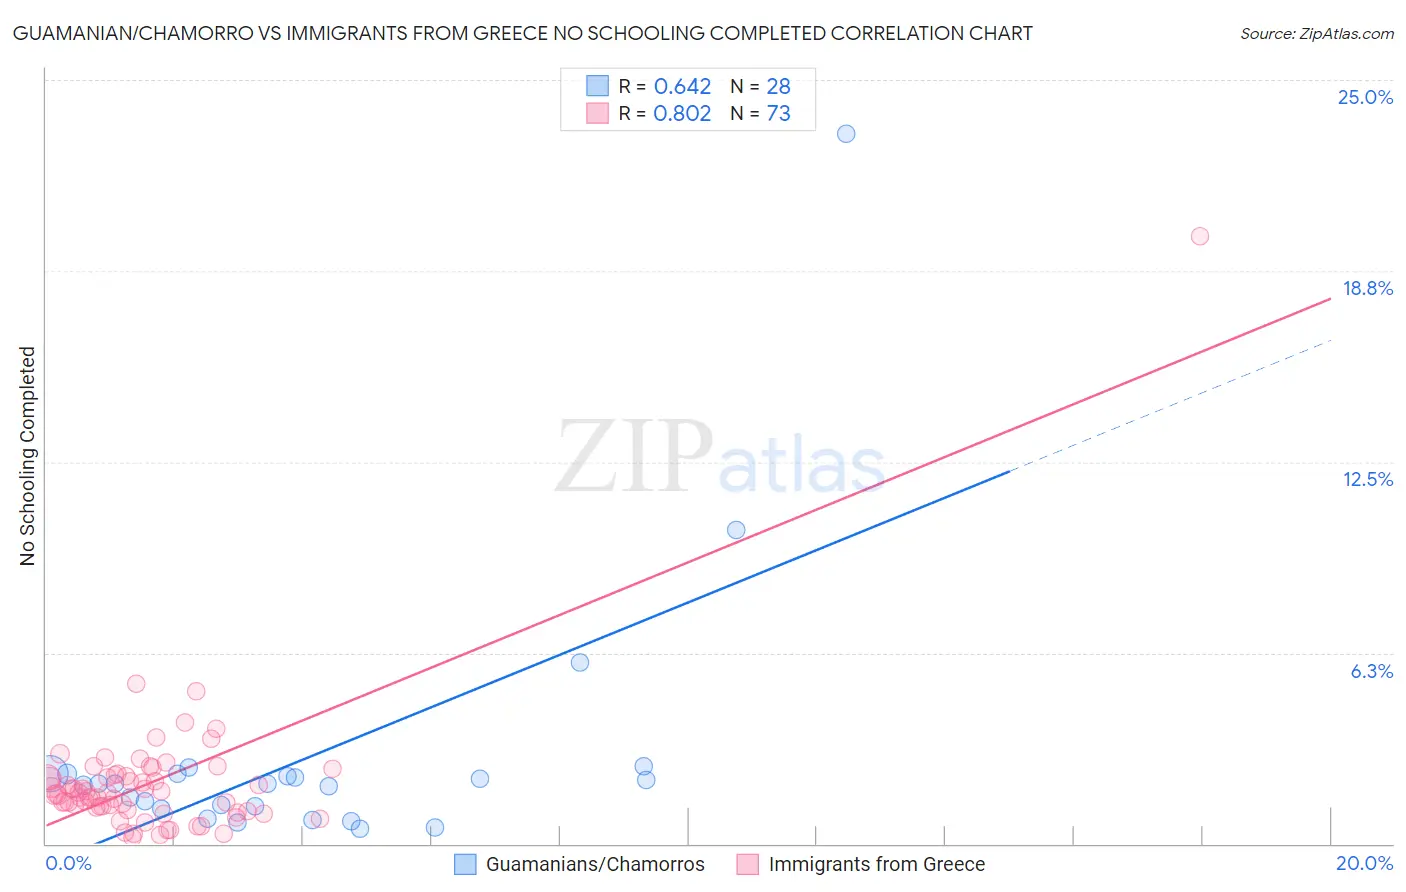
Guamanian/Chamorro vs Immigrants from Greece No Schooling Completed Correlation Chart
The statistical analysis conducted on geographies consisting of 220,951,365 people shows a significant positive correlation between the proportion of Guamanians/Chamorros and percentage of population with no schooling in the United States with a correlation coefficient (R) of 0.642 and weighted average of 2.2%. Similarly, the statistical analysis conducted on geographies consisting of 215,786,683 people shows a very strong positive correlation between the proportion of Immigrants from Greece and percentage of population with no schooling in the United States with a correlation coefficient (R) of 0.802 and weighted average of 2.0%, a difference of 8.8%.
No Schooling Completed Correlation Summary
| Measurement | Guamanian/Chamorro | Immigrants from Greece |
| Minimum | 0.47% | 0.20% |
| Maximum | 23.2% | 19.9% |
| Range | 22.8% | 19.7% |
| Mean | 2.9% | 2.0% |
| Median | 2.0% | 1.6% |
| Interquartile 25% (IQ1) | 1.2% | 1.2% |
| Interquartile 75% (IQ3) | 2.3% | 2.2% |
| Interquartile Range (IQR) | 1.1% | 1.1% |
| Standard Deviation (Sample) | 4.4% | 2.3% |
| Standard Deviation (Population) | 4.3% | 2.3% |
Similar Demographics by No Schooling Completed
Demographics Similar to Guamanians/Chamorros by No Schooling Completed
In terms of no schooling completed, the demographic groups most similar to Guamanians/Chamorros are Paraguayan (2.2%, a difference of 0.080%), Bermudan (2.1%, a difference of 0.14%), Immigrants from Albania (2.2%, a difference of 0.24%), Spanish American (2.1%, a difference of 0.43%), and Hawaiian (2.2%, a difference of 0.44%).
| Demographics | Rating | Rank | No Schooling Completed |
| Mongolians | 40.8 /100 | #185 | Average 2.1% |
| Immigrants | Bosnia and Herzegovina | 38.6 /100 | #186 | Fair 2.1% |
| Navajo | 36.5 /100 | #187 | Fair 2.1% |
| Immigrants | Kenya | 36.2 /100 | #188 | Fair 2.1% |
| Immigrants | Egypt | 36.1 /100 | #189 | Fair 2.1% |
| Spanish Americans | 32.6 /100 | #190 | Fair 2.1% |
| Bermudans | 30.7 /100 | #191 | Fair 2.1% |
| Guamanians/Chamorros | 29.8 /100 | #192 | Fair 2.2% |
| Paraguayans | 29.3 /100 | #193 | Fair 2.2% |
| Immigrants | Albania | 28.3 /100 | #194 | Fair 2.2% |
| Hawaiians | 27.0 /100 | #195 | Fair 2.2% |
| Immigrants | Ukraine | 26.1 /100 | #196 | Fair 2.2% |
| Immigrants | Southern Europe | 23.8 /100 | #197 | Fair 2.2% |
| Immigrants | Chile | 22.7 /100 | #198 | Fair 2.2% |
| Africans | 21.8 /100 | #199 | Fair 2.2% |
Demographics Similar to Immigrants from Greece by No Schooling Completed
In terms of no schooling completed, the demographic groups most similar to Immigrants from Greece are Marshallese (2.0%, a difference of 0.010%), Jordanian (2.0%, a difference of 0.27%), Venezuelan (2.0%, a difference of 0.49%), Immigrants from Israel (2.0%, a difference of 0.52%), and Filipino (2.0%, a difference of 0.56%).
| Demographics | Rating | Rank | No Schooling Completed |
| Menominee | 89.6 /100 | #134 | Excellent 1.9% |
| Hmong | 88.5 /100 | #135 | Excellent 1.9% |
| Burmese | 88.2 /100 | #136 | Excellent 1.9% |
| Filipinos | 85.5 /100 | #137 | Excellent 2.0% |
| Immigrants | Israel | 85.4 /100 | #138 | Excellent 2.0% |
| Jordanians | 84.5 /100 | #139 | Excellent 2.0% |
| Marshallese | 83.5 /100 | #140 | Excellent 2.0% |
| Immigrants | Greece | 83.5 /100 | #141 | Excellent 2.0% |
| Venezuelans | 81.5 /100 | #142 | Excellent 2.0% |
| Immigrants | South Central Asia | 80.0 /100 | #143 | Good 2.0% |
| Alsatians | 79.1 /100 | #144 | Good 2.0% |
| Immigrants | Iran | 79.0 /100 | #145 | Good 2.0% |
| Immigrants | Moldova | 78.0 /100 | #146 | Good 2.0% |
| Soviet Union | 77.1 /100 | #147 | Good 2.0% |
| Shoshone | 76.7 /100 | #148 | Good 2.0% |