Apache vs Pueblo No Schooling Completed
COMPARE
Apache
Pueblo
No Schooling Completed
No Schooling Completed Comparison
Apache
Pueblo
2.1%
NO SCHOOLING COMPLETED
56.7/ 100
METRIC RATING
169th/ 347
METRIC RANK
1.9%
NO SCHOOLING COMPLETED
96.4/ 100
METRIC RATING
112th/ 347
METRIC RANK
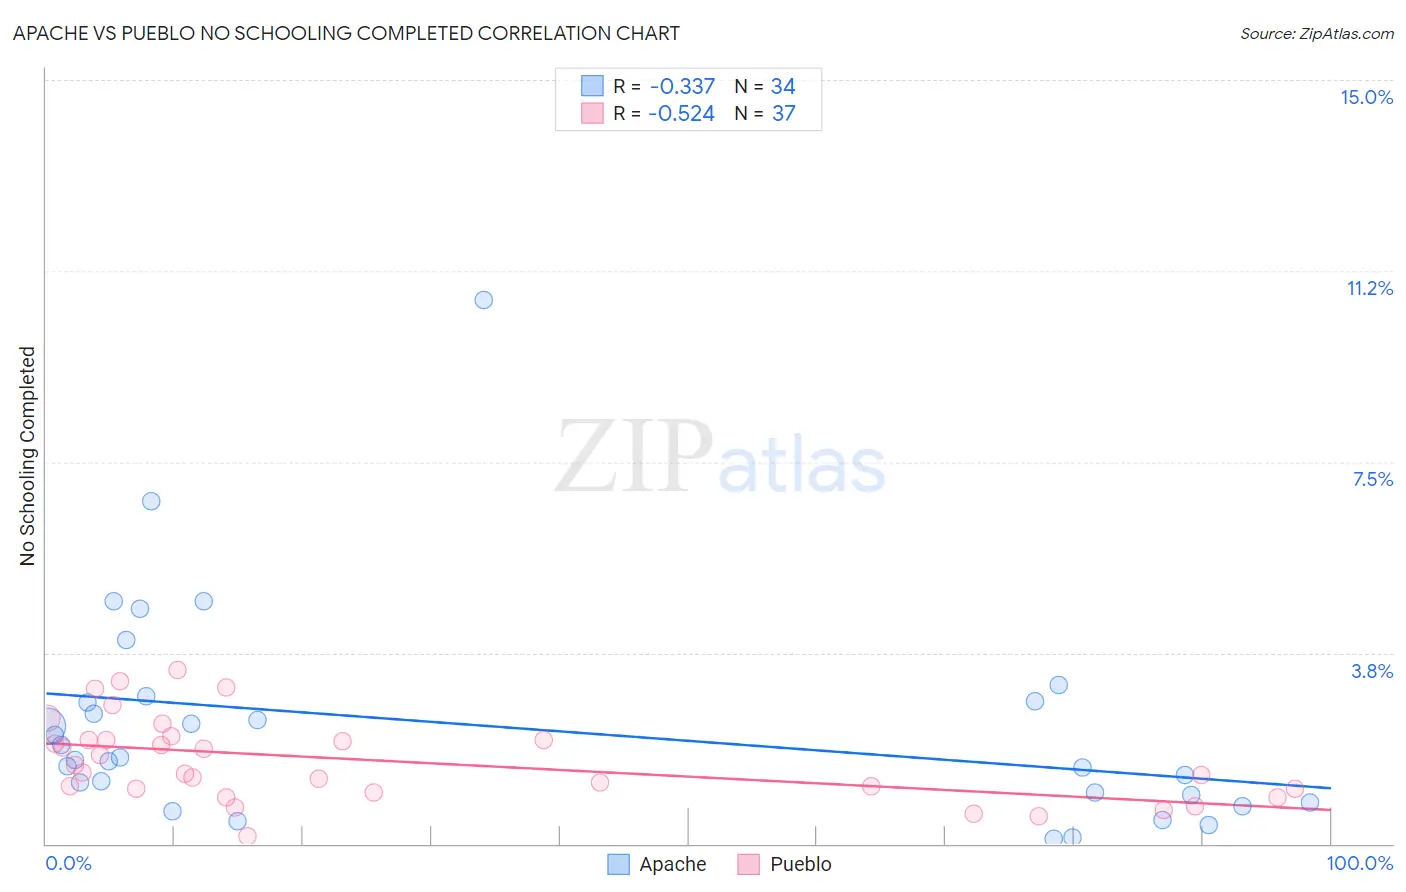
Apache vs Pueblo No Schooling Completed Correlation Chart
The statistical analysis conducted on geographies consisting of 229,858,613 people shows a mild negative correlation between the proportion of Apache and percentage of population with no schooling in the United States with a correlation coefficient (R) of -0.337 and weighted average of 2.1%. Similarly, the statistical analysis conducted on geographies consisting of 119,717,699 people shows a substantial negative correlation between the proportion of Pueblo and percentage of population with no schooling in the United States with a correlation coefficient (R) of -0.524 and weighted average of 1.9%, a difference of 11.4%.
No Schooling Completed Correlation Summary
| Measurement | Apache | Pueblo |
| Minimum | 0.098% | 0.16% |
| Maximum | 10.7% | 3.4% |
| Range | 10.6% | 3.2% |
| Mean | 2.3% | 1.6% |
| Median | 1.7% | 1.4% |
| Interquartile 25% (IQ1) | 0.95% | 1.0% |
| Interquartile 75% (IQ3) | 2.8% | 2.0% |
| Interquartile Range (IQR) | 1.9% | 1.00% |
| Standard Deviation (Sample) | 2.1% | 0.81% |
| Standard Deviation (Population) | 2.1% | 0.80% |
Similar Demographics by No Schooling Completed
Demographics Similar to Apache by No Schooling Completed
In terms of no schooling completed, the demographic groups most similar to Apache are Argentinean (2.1%, a difference of 0.090%), Immigrants from Poland (2.1%, a difference of 0.20%), Cheyenne (2.1%, a difference of 0.27%), Egyptian (2.1%, a difference of 0.35%), and Dutch West Indian (2.1%, a difference of 0.46%).
| Demographics | Rating | Rank | No Schooling Completed |
| Immigrants | Brazil | 63.8 /100 | #162 | Good 2.1% |
| Albanians | 62.2 /100 | #163 | Good 2.1% |
| Comanche | 60.7 /100 | #164 | Good 2.1% |
| Brazilians | 60.2 /100 | #165 | Good 2.1% |
| Dutch West Indians | 59.9 /100 | #166 | Average 2.1% |
| Egyptians | 59.2 /100 | #167 | Average 2.1% |
| Cheyenne | 58.6 /100 | #168 | Average 2.1% |
| Apache | 56.7 /100 | #169 | Average 2.1% |
| Argentineans | 56.0 /100 | #170 | Average 2.1% |
| Immigrants | Poland | 55.2 /100 | #171 | Average 2.1% |
| Immigrants | Argentina | 52.7 /100 | #172 | Average 2.1% |
| Immigrants | Belarus | 51.8 /100 | #173 | Average 2.1% |
| Immigrants | Micronesia | 50.0 /100 | #174 | Average 2.1% |
| Arabs | 46.4 /100 | #175 | Average 2.1% |
| Panamanians | 45.2 /100 | #176 | Average 2.1% |
Demographics Similar to Pueblo by No Schooling Completed
In terms of no schooling completed, the demographic groups most similar to Pueblo are Immigrants from Japan (1.9%, a difference of 0.19%), Immigrants from Zimbabwe (1.9%, a difference of 0.25%), Immigrants from Norway (1.9%, a difference of 0.25%), Immigrants from Latvia (1.9%, a difference of 0.33%), and Syrian (1.9%, a difference of 0.38%).
| Demographics | Rating | Rank | No Schooling Completed |
| German Russians | 97.5 /100 | #105 | Exceptional 1.8% |
| Immigrants | France | 97.3 /100 | #106 | Exceptional 1.8% |
| Yugoslavians | 97.2 /100 | #107 | Exceptional 1.8% |
| Okinawans | 97.1 /100 | #108 | Exceptional 1.8% |
| Immigrants | Saudi Arabia | 96.8 /100 | #109 | Exceptional 1.9% |
| Immigrants | Latvia | 96.7 /100 | #110 | Exceptional 1.9% |
| Immigrants | Japan | 96.6 /100 | #111 | Exceptional 1.9% |
| Pueblo | 96.4 /100 | #112 | Exceptional 1.9% |
| Immigrants | Zimbabwe | 96.2 /100 | #113 | Exceptional 1.9% |
| Immigrants | Norway | 96.1 /100 | #114 | Exceptional 1.9% |
| Syrians | 96.0 /100 | #115 | Exceptional 1.9% |
| Lebanese | 96.0 /100 | #116 | Exceptional 1.9% |
| Immigrants | Serbia | 95.8 /100 | #117 | Exceptional 1.9% |
| Spanish | 95.5 /100 | #118 | Exceptional 1.9% |
| Iroquois | 95.1 /100 | #119 | Exceptional 1.9% |