Nepalese vs Immigrants from Greece No Schooling Completed
COMPARE
Nepalese
Immigrants from Greece
No Schooling Completed
No Schooling Completed Comparison
Nepalese
Immigrants from Greece
3.8%
NO SCHOOLING COMPLETED
0.0/ 100
METRIC RATING
344th/ 347
METRIC RANK
2.0%
NO SCHOOLING COMPLETED
83.5/ 100
METRIC RATING
141st/ 347
METRIC RANK
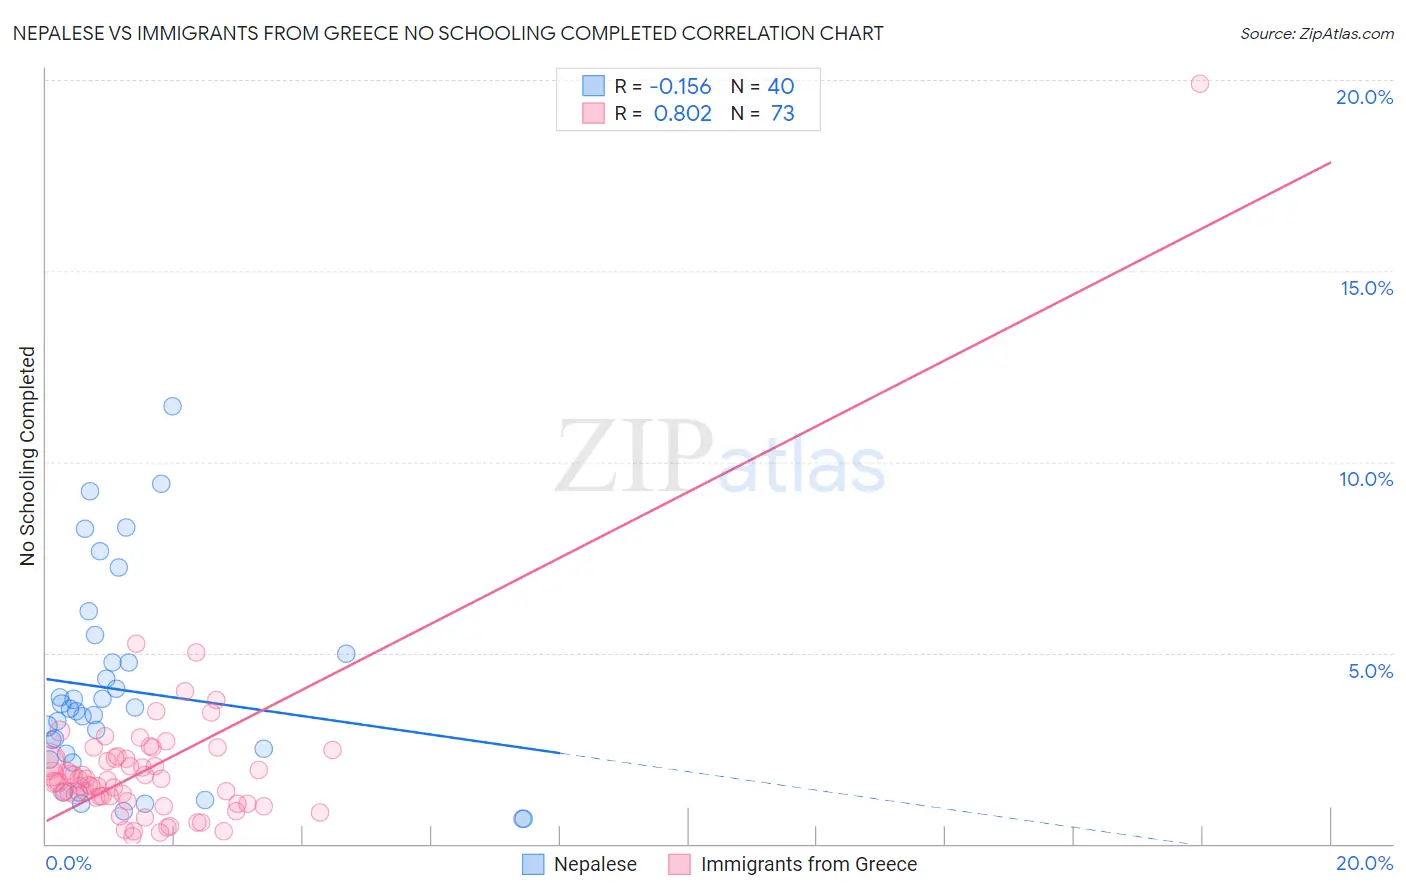
Nepalese vs Immigrants from Greece No Schooling Completed Correlation Chart
The statistical analysis conducted on geographies consisting of 24,510,165 people shows a poor negative correlation between the proportion of Nepalese and percentage of population with no schooling in the United States with a correlation coefficient (R) of -0.156 and weighted average of 3.8%. Similarly, the statistical analysis conducted on geographies consisting of 215,786,683 people shows a very strong positive correlation between the proportion of Immigrants from Greece and percentage of population with no schooling in the United States with a correlation coefficient (R) of 0.802 and weighted average of 2.0%, a difference of 92.5%.
No Schooling Completed Correlation Summary
| Measurement | Nepalese | Immigrants from Greece |
| Minimum | 0.66% | 0.20% |
| Maximum | 11.5% | 19.9% |
| Range | 10.8% | 19.7% |
| Mean | 4.0% | 2.0% |
| Median | 3.5% | 1.6% |
| Interquartile 25% (IQ1) | 2.3% | 1.2% |
| Interquartile 75% (IQ3) | 4.9% | 2.2% |
| Interquartile Range (IQR) | 2.6% | 1.1% |
| Standard Deviation (Sample) | 2.6% | 2.3% |
| Standard Deviation (Population) | 2.6% | 2.3% |
Similar Demographics by No Schooling Completed
Demographics Similar to Nepalese by No Schooling Completed
In terms of no schooling completed, the demographic groups most similar to Nepalese are Salvadoran (3.7%, a difference of 1.7%), Immigrants from El Salvador (3.9%, a difference of 1.8%), Immigrants from Mexico (3.6%, a difference of 4.5%), Immigrants from Central America (3.6%, a difference of 5.3%), and Immigrants from Guatemala (3.6%, a difference of 6.4%).
| Demographics | Rating | Rank | No Schooling Completed |
| Immigrants | Dominican Republic | 0.0 /100 | #333 | Tragic 3.4% |
| Guatemalans | 0.0 /100 | #334 | Tragic 3.5% |
| Immigrants | Cambodia | 0.0 /100 | #335 | Tragic 3.5% |
| Immigrants | Fiji | 0.0 /100 | #336 | Tragic 3.5% |
| Immigrants | Cabo Verde | 0.0 /100 | #337 | Tragic 3.5% |
| Bangladeshis | 0.0 /100 | #338 | Tragic 3.5% |
| Yakama | 0.0 /100 | #339 | Tragic 3.6% |
| Immigrants | Guatemala | 0.0 /100 | #340 | Tragic 3.6% |
| Immigrants | Central America | 0.0 /100 | #341 | Tragic 3.6% |
| Immigrants | Mexico | 0.0 /100 | #342 | Tragic 3.6% |
| Salvadorans | 0.0 /100 | #343 | Tragic 3.7% |
| Nepalese | 0.0 /100 | #344 | Tragic 3.8% |
| Immigrants | El Salvador | 0.0 /100 | #345 | Tragic 3.9% |
| Immigrants | Yemen | 0.0 /100 | #346 | Tragic 4.1% |
| Spanish American Indians | 0.0 /100 | #347 | Tragic 4.2% |
Demographics Similar to Immigrants from Greece by No Schooling Completed
In terms of no schooling completed, the demographic groups most similar to Immigrants from Greece are Marshallese (2.0%, a difference of 0.010%), Jordanian (2.0%, a difference of 0.27%), Venezuelan (2.0%, a difference of 0.49%), Immigrants from Israel (2.0%, a difference of 0.52%), and Filipino (2.0%, a difference of 0.56%).
| Demographics | Rating | Rank | No Schooling Completed |
| Menominee | 89.6 /100 | #134 | Excellent 1.9% |
| Hmong | 88.5 /100 | #135 | Excellent 1.9% |
| Burmese | 88.2 /100 | #136 | Excellent 1.9% |
| Filipinos | 85.5 /100 | #137 | Excellent 2.0% |
| Immigrants | Israel | 85.4 /100 | #138 | Excellent 2.0% |
| Jordanians | 84.5 /100 | #139 | Excellent 2.0% |
| Marshallese | 83.5 /100 | #140 | Excellent 2.0% |
| Immigrants | Greece | 83.5 /100 | #141 | Excellent 2.0% |
| Venezuelans | 81.5 /100 | #142 | Excellent 2.0% |
| Immigrants | South Central Asia | 80.0 /100 | #143 | Good 2.0% |
| Alsatians | 79.1 /100 | #144 | Good 2.0% |
| Immigrants | Iran | 79.0 /100 | #145 | Good 2.0% |
| Immigrants | Moldova | 78.0 /100 | #146 | Good 2.0% |
| Soviet Union | 77.1 /100 | #147 | Good 2.0% |
| Shoshone | 76.7 /100 | #148 | Good 2.0% |