Indonesian vs Filipino Associate's Degree
COMPARE
Indonesian
Filipino
Associate's Degree
Associate's Degree Comparison
Indonesians
Filipinos
41.9%
ASSOCIATE'S DEGREE
0.6/ 100
METRIC RATING
253rd/ 347
METRIC RANK
59.8%
ASSOCIATE'S DEGREE
100.0/ 100
METRIC RATING
1st/ 347
METRIC RANK
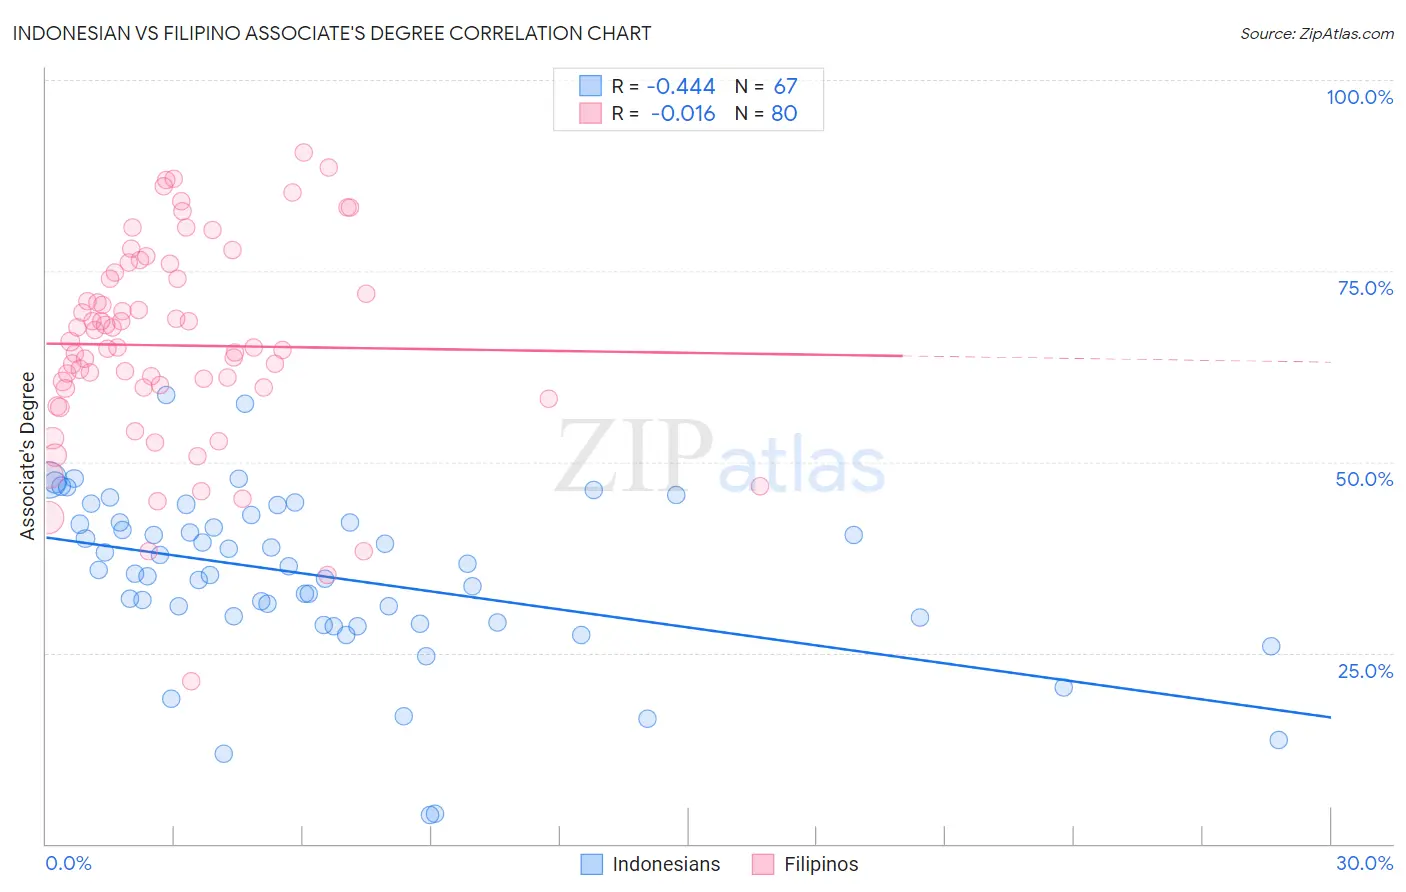
Indonesian vs Filipino Associate's Degree Correlation Chart
The statistical analysis conducted on geographies consisting of 162,722,822 people shows a moderate negative correlation between the proportion of Indonesians and percentage of population with at least associate's degree education in the United States with a correlation coefficient (R) of -0.444 and weighted average of 41.9%. Similarly, the statistical analysis conducted on geographies consisting of 254,337,502 people shows no correlation between the proportion of Filipinos and percentage of population with at least associate's degree education in the United States with a correlation coefficient (R) of -0.016 and weighted average of 59.8%, a difference of 42.7%.
Associate's Degree Correlation Summary
| Measurement | Indonesian | Filipino |
| Minimum | 3.8% | 21.2% |
| Maximum | 58.7% | 90.5% |
| Range | 54.9% | 69.3% |
| Mean | 35.0% | 65.3% |
| Median | 35.9% | 65.0% |
| Interquartile 25% (IQ1) | 29.0% | 59.7% |
| Interquartile 75% (IQ3) | 42.1% | 74.4% |
| Interquartile Range (IQR) | 13.1% | 14.7% |
| Standard Deviation (Sample) | 11.0% | 13.5% |
| Standard Deviation (Population) | 10.9% | 13.4% |
Similar Demographics by Associate's Degree
Demographics Similar to Indonesians by Associate's Degree
In terms of associate's degree, the demographic groups most similar to Indonesians are Cuban (41.9%, a difference of 0.060%), French American Indian (42.0%, a difference of 0.10%), Immigrants from Guyana (41.8%, a difference of 0.15%), Immigrants from Congo (41.8%, a difference of 0.28%), and Spanish American (41.8%, a difference of 0.34%).
| Demographics | Rating | Rank | Associate's Degree |
| Delaware | 0.9 /100 | #246 | Tragic 42.3% |
| Immigrants | Fiji | 0.8 /100 | #247 | Tragic 42.2% |
| Immigrants | Ecuador | 0.8 /100 | #248 | Tragic 42.2% |
| Jamaicans | 0.7 /100 | #249 | Tragic 42.1% |
| U.S. Virgin Islanders | 0.7 /100 | #250 | Tragic 42.1% |
| Immigrants | Bahamas | 0.7 /100 | #251 | Tragic 42.1% |
| French American Indians | 0.6 /100 | #252 | Tragic 42.0% |
| Indonesians | 0.6 /100 | #253 | Tragic 41.9% |
| Cubans | 0.6 /100 | #254 | Tragic 41.9% |
| Immigrants | Guyana | 0.5 /100 | #255 | Tragic 41.8% |
| Immigrants | Congo | 0.5 /100 | #256 | Tragic 41.8% |
| Spanish Americans | 0.5 /100 | #257 | Tragic 41.8% |
| Japanese | 0.5 /100 | #258 | Tragic 41.7% |
| Malaysians | 0.4 /100 | #259 | Tragic 41.6% |
| Marshallese | 0.4 /100 | #260 | Tragic 41.6% |
Demographics Similar to Filipinos by Associate's Degree
In terms of associate's degree, the demographic groups most similar to Filipinos are Immigrants from Singapore (58.9%, a difference of 1.5%), Immigrants from India (58.5%, a difference of 2.1%), Immigrants from Taiwan (58.4%, a difference of 2.4%), Iranian (58.2%, a difference of 2.8%), and Okinawan (57.7%, a difference of 3.7%).
| Demographics | Rating | Rank | Associate's Degree |
| Filipinos | 100.0 /100 | #1 | Exceptional 59.8% |
| Immigrants | Singapore | 100.0 /100 | #2 | Exceptional 58.9% |
| Immigrants | India | 100.0 /100 | #3 | Exceptional 58.5% |
| Immigrants | Taiwan | 100.0 /100 | #4 | Exceptional 58.4% |
| Iranians | 100.0 /100 | #5 | Exceptional 58.2% |
| Okinawans | 100.0 /100 | #6 | Exceptional 57.7% |
| Immigrants | Iran | 100.0 /100 | #7 | Exceptional 57.7% |
| Thais | 100.0 /100 | #8 | Exceptional 57.4% |
| Immigrants | Israel | 100.0 /100 | #9 | Exceptional 56.8% |
| Cypriots | 100.0 /100 | #10 | Exceptional 56.4% |
| Immigrants | Australia | 100.0 /100 | #11 | Exceptional 55.8% |
| Immigrants | South Central Asia | 100.0 /100 | #12 | Exceptional 55.7% |
| Immigrants | China | 100.0 /100 | #13 | Exceptional 55.5% |
| Immigrants | Hong Kong | 100.0 /100 | #14 | Exceptional 55.4% |
| Immigrants | Eastern Asia | 100.0 /100 | #15 | Exceptional 55.4% |