Immigrants from Albania vs Filipino Associate's Degree
COMPARE
Immigrants from Albania
Filipino
Associate's Degree
Associate's Degree Comparison
Immigrants from Albania
Filipinos
48.2%
ASSOCIATE'S DEGREE
89.9/ 100
METRIC RATING
132nd/ 347
METRIC RANK
59.8%
ASSOCIATE'S DEGREE
100.0/ 100
METRIC RATING
1st/ 347
METRIC RANK
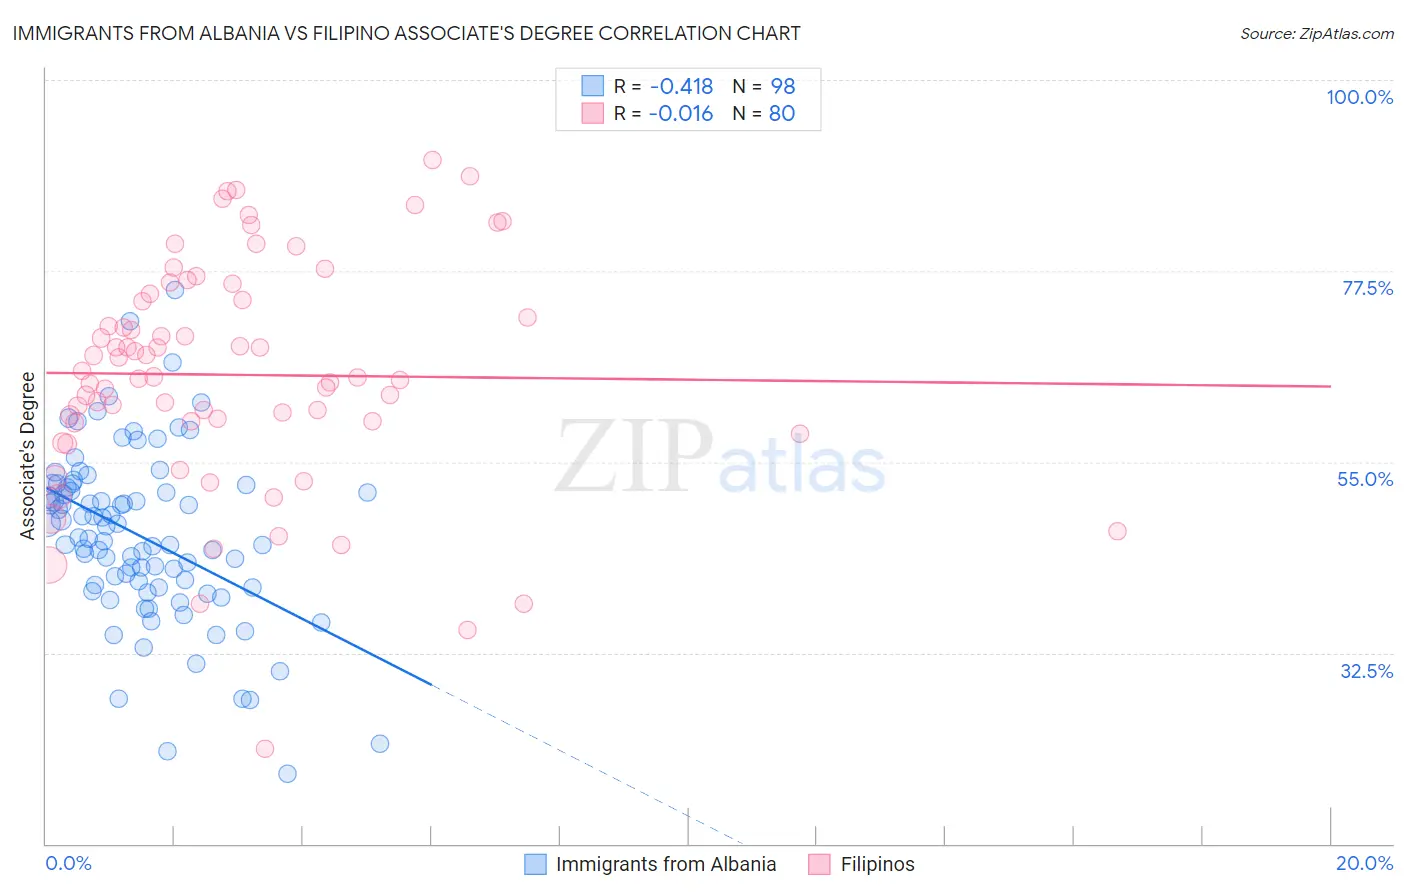
Immigrants from Albania vs Filipino Associate's Degree Correlation Chart
The statistical analysis conducted on geographies consisting of 119,391,185 people shows a moderate negative correlation between the proportion of Immigrants from Albania and percentage of population with at least associate's degree education in the United States with a correlation coefficient (R) of -0.418 and weighted average of 48.2%. Similarly, the statistical analysis conducted on geographies consisting of 254,337,502 people shows no correlation between the proportion of Filipinos and percentage of population with at least associate's degree education in the United States with a correlation coefficient (R) of -0.016 and weighted average of 59.8%, a difference of 23.9%.
Associate's Degree Correlation Summary
| Measurement | Immigrants from Albania | Filipino |
| Minimum | 18.3% | 21.2% |
| Maximum | 75.3% | 90.5% |
| Range | 57.0% | 69.3% |
| Mean | 46.2% | 65.3% |
| Median | 46.0% | 65.0% |
| Interquartile 25% (IQ1) | 40.3% | 59.7% |
| Interquartile 75% (IQ3) | 52.0% | 74.4% |
| Interquartile Range (IQR) | 11.7% | 14.7% |
| Standard Deviation (Sample) | 10.1% | 13.5% |
| Standard Deviation (Population) | 10.1% | 13.4% |
Similar Demographics by Associate's Degree
Demographics Similar to Immigrants from Albania by Associate's Degree
In terms of associate's degree, the demographic groups most similar to Immigrants from Albania are Assyrian/Chaldean/Syriac (48.2%, a difference of 0.080%), Moroccan (48.2%, a difference of 0.10%), European (48.2%, a difference of 0.16%), Icelander (48.3%, a difference of 0.18%), and Immigrants from Jordan (48.4%, a difference of 0.29%).
| Demographics | Rating | Rank | Associate's Degree |
| Chinese | 92.5 /100 | #125 | Exceptional 48.5% |
| Immigrants | Syria | 92.2 /100 | #126 | Exceptional 48.5% |
| Immigrants | Uganda | 92.1 /100 | #127 | Exceptional 48.5% |
| Immigrants | Eastern Africa | 91.6 /100 | #128 | Exceptional 48.4% |
| Swedes | 91.5 /100 | #129 | Exceptional 48.4% |
| Immigrants | Jordan | 91.2 /100 | #130 | Exceptional 48.4% |
| Icelanders | 90.8 /100 | #131 | Exceptional 48.3% |
| Immigrants | Albania | 89.9 /100 | #132 | Excellent 48.2% |
| Assyrians/Chaldeans/Syriacs | 89.4 /100 | #133 | Excellent 48.2% |
| Moroccans | 89.3 /100 | #134 | Excellent 48.2% |
| Europeans | 89.0 /100 | #135 | Excellent 48.2% |
| Pakistanis | 88.0 /100 | #136 | Excellent 48.1% |
| Immigrants | Eritrea | 87.8 /100 | #137 | Excellent 48.1% |
| Poles | 87.3 /100 | #138 | Excellent 48.0% |
| Slovenes | 85.1 /100 | #139 | Excellent 47.9% |
Demographics Similar to Filipinos by Associate's Degree
In terms of associate's degree, the demographic groups most similar to Filipinos are Immigrants from Singapore (58.9%, a difference of 1.5%), Immigrants from India (58.5%, a difference of 2.1%), Immigrants from Taiwan (58.4%, a difference of 2.4%), Iranian (58.2%, a difference of 2.8%), and Okinawan (57.7%, a difference of 3.7%).
| Demographics | Rating | Rank | Associate's Degree |
| Filipinos | 100.0 /100 | #1 | Exceptional 59.8% |
| Immigrants | Singapore | 100.0 /100 | #2 | Exceptional 58.9% |
| Immigrants | India | 100.0 /100 | #3 | Exceptional 58.5% |
| Immigrants | Taiwan | 100.0 /100 | #4 | Exceptional 58.4% |
| Iranians | 100.0 /100 | #5 | Exceptional 58.2% |
| Okinawans | 100.0 /100 | #6 | Exceptional 57.7% |
| Immigrants | Iran | 100.0 /100 | #7 | Exceptional 57.7% |
| Thais | 100.0 /100 | #8 | Exceptional 57.4% |
| Immigrants | Israel | 100.0 /100 | #9 | Exceptional 56.8% |
| Cypriots | 100.0 /100 | #10 | Exceptional 56.4% |
| Immigrants | Australia | 100.0 /100 | #11 | Exceptional 55.8% |
| Immigrants | South Central Asia | 100.0 /100 | #12 | Exceptional 55.7% |
| Immigrants | China | 100.0 /100 | #13 | Exceptional 55.5% |
| Immigrants | Hong Kong | 100.0 /100 | #14 | Exceptional 55.4% |
| Immigrants | Eastern Asia | 100.0 /100 | #15 | Exceptional 55.4% |