Northern European vs Filipino Associate's Degree
COMPARE
Northern European
Filipino
Associate's Degree
Associate's Degree Comparison
Northern Europeans
Filipinos
49.5%
ASSOCIATE'S DEGREE
97.3/ 100
METRIC RATING
101st/ 347
METRIC RANK
59.8%
ASSOCIATE'S DEGREE
100.0/ 100
METRIC RATING
1st/ 347
METRIC RANK
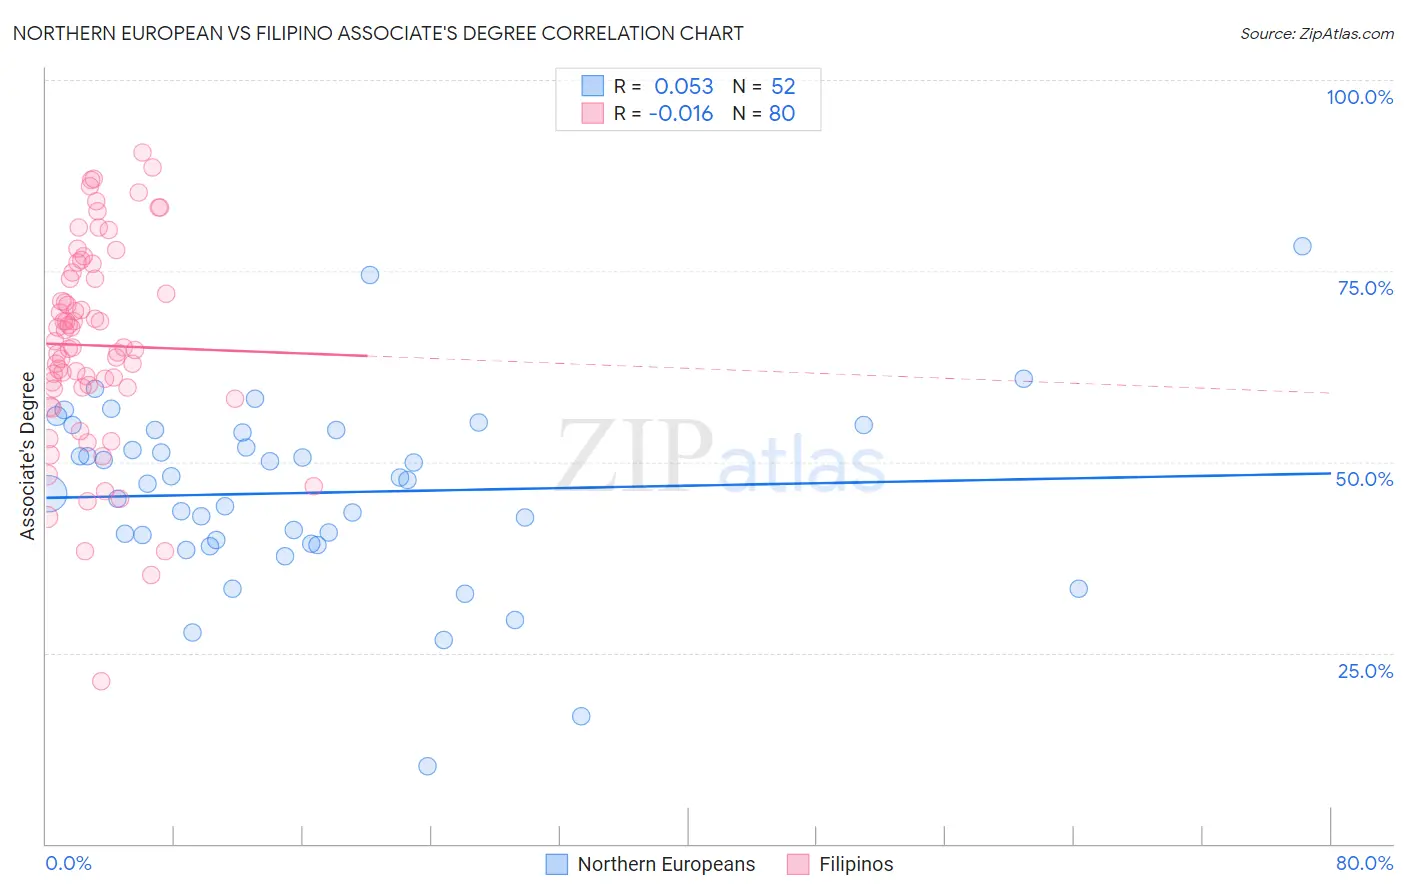
Northern European vs Filipino Associate's Degree Correlation Chart
The statistical analysis conducted on geographies consisting of 406,085,887 people shows a slight positive correlation between the proportion of Northern Europeans and percentage of population with at least associate's degree education in the United States with a correlation coefficient (R) of 0.053 and weighted average of 49.5%. Similarly, the statistical analysis conducted on geographies consisting of 254,337,502 people shows no correlation between the proportion of Filipinos and percentage of population with at least associate's degree education in the United States with a correlation coefficient (R) of -0.016 and weighted average of 59.8%, a difference of 20.9%.
Associate's Degree Correlation Summary
| Measurement | Northern European | Filipino |
| Minimum | 10.2% | 21.2% |
| Maximum | 78.2% | 90.5% |
| Range | 68.0% | 69.3% |
| Mean | 46.0% | 65.3% |
| Median | 47.4% | 65.0% |
| Interquartile 25% (IQ1) | 39.6% | 59.7% |
| Interquartile 75% (IQ3) | 54.0% | 74.4% |
| Interquartile Range (IQR) | 14.4% | 14.7% |
| Standard Deviation (Sample) | 12.1% | 13.5% |
| Standard Deviation (Population) | 12.0% | 13.4% |
Similar Demographics by Associate's Degree
Demographics Similar to Northern Europeans by Associate's Degree
In terms of associate's degree, the demographic groups most similar to Northern Europeans are Chilean (49.4%, a difference of 0.030%), Ukrainian (49.4%, a difference of 0.13%), Immigrants from Nepal (49.5%, a difference of 0.16%), Venezuelan (49.4%, a difference of 0.20%), and Croatian (49.3%, a difference of 0.34%).
| Demographics | Rating | Rank | Associate's Degree |
| Laotians | 98.4 /100 | #94 | Exceptional 49.9% |
| Immigrants | England | 98.0 /100 | #95 | Exceptional 49.7% |
| Romanians | 98.0 /100 | #96 | Exceptional 49.7% |
| Immigrants | Ukraine | 98.0 /100 | #97 | Exceptional 49.7% |
| Immigrants | Northern Africa | 97.9 /100 | #98 | Exceptional 49.7% |
| Macedonians | 97.8 /100 | #99 | Exceptional 49.6% |
| Immigrants | Nepal | 97.5 /100 | #100 | Exceptional 49.5% |
| Northern Europeans | 97.3 /100 | #101 | Exceptional 49.5% |
| Chileans | 97.3 /100 | #102 | Exceptional 49.4% |
| Ukrainians | 97.1 /100 | #103 | Exceptional 49.4% |
| Venezuelans | 97.0 /100 | #104 | Exceptional 49.4% |
| Croatians | 96.8 /100 | #105 | Exceptional 49.3% |
| Immigrants | Italy | 96.7 /100 | #106 | Exceptional 49.3% |
| Syrians | 96.7 /100 | #107 | Exceptional 49.3% |
| Jordanians | 96.6 /100 | #108 | Exceptional 49.2% |
Demographics Similar to Filipinos by Associate's Degree
In terms of associate's degree, the demographic groups most similar to Filipinos are Immigrants from Singapore (58.9%, a difference of 1.5%), Immigrants from India (58.5%, a difference of 2.1%), Immigrants from Taiwan (58.4%, a difference of 2.4%), Iranian (58.2%, a difference of 2.8%), and Okinawan (57.7%, a difference of 3.7%).
| Demographics | Rating | Rank | Associate's Degree |
| Filipinos | 100.0 /100 | #1 | Exceptional 59.8% |
| Immigrants | Singapore | 100.0 /100 | #2 | Exceptional 58.9% |
| Immigrants | India | 100.0 /100 | #3 | Exceptional 58.5% |
| Immigrants | Taiwan | 100.0 /100 | #4 | Exceptional 58.4% |
| Iranians | 100.0 /100 | #5 | Exceptional 58.2% |
| Okinawans | 100.0 /100 | #6 | Exceptional 57.7% |
| Immigrants | Iran | 100.0 /100 | #7 | Exceptional 57.7% |
| Thais | 100.0 /100 | #8 | Exceptional 57.4% |
| Immigrants | Israel | 100.0 /100 | #9 | Exceptional 56.8% |
| Cypriots | 100.0 /100 | #10 | Exceptional 56.4% |
| Immigrants | Australia | 100.0 /100 | #11 | Exceptional 55.8% |
| Immigrants | South Central Asia | 100.0 /100 | #12 | Exceptional 55.7% |
| Immigrants | China | 100.0 /100 | #13 | Exceptional 55.5% |
| Immigrants | Hong Kong | 100.0 /100 | #14 | Exceptional 55.4% |
| Immigrants | Eastern Asia | 100.0 /100 | #15 | Exceptional 55.4% |