Blackfeet vs Filipino Associate's Degree
COMPARE
Blackfeet
Filipino
Associate's Degree
Associate's Degree Comparison
Blackfeet
Filipinos
40.3%
ASSOCIATE'S DEGREE
0.1/ 100
METRIC RATING
277th/ 347
METRIC RANK
59.8%
ASSOCIATE'S DEGREE
100.0/ 100
METRIC RATING
1st/ 347
METRIC RANK
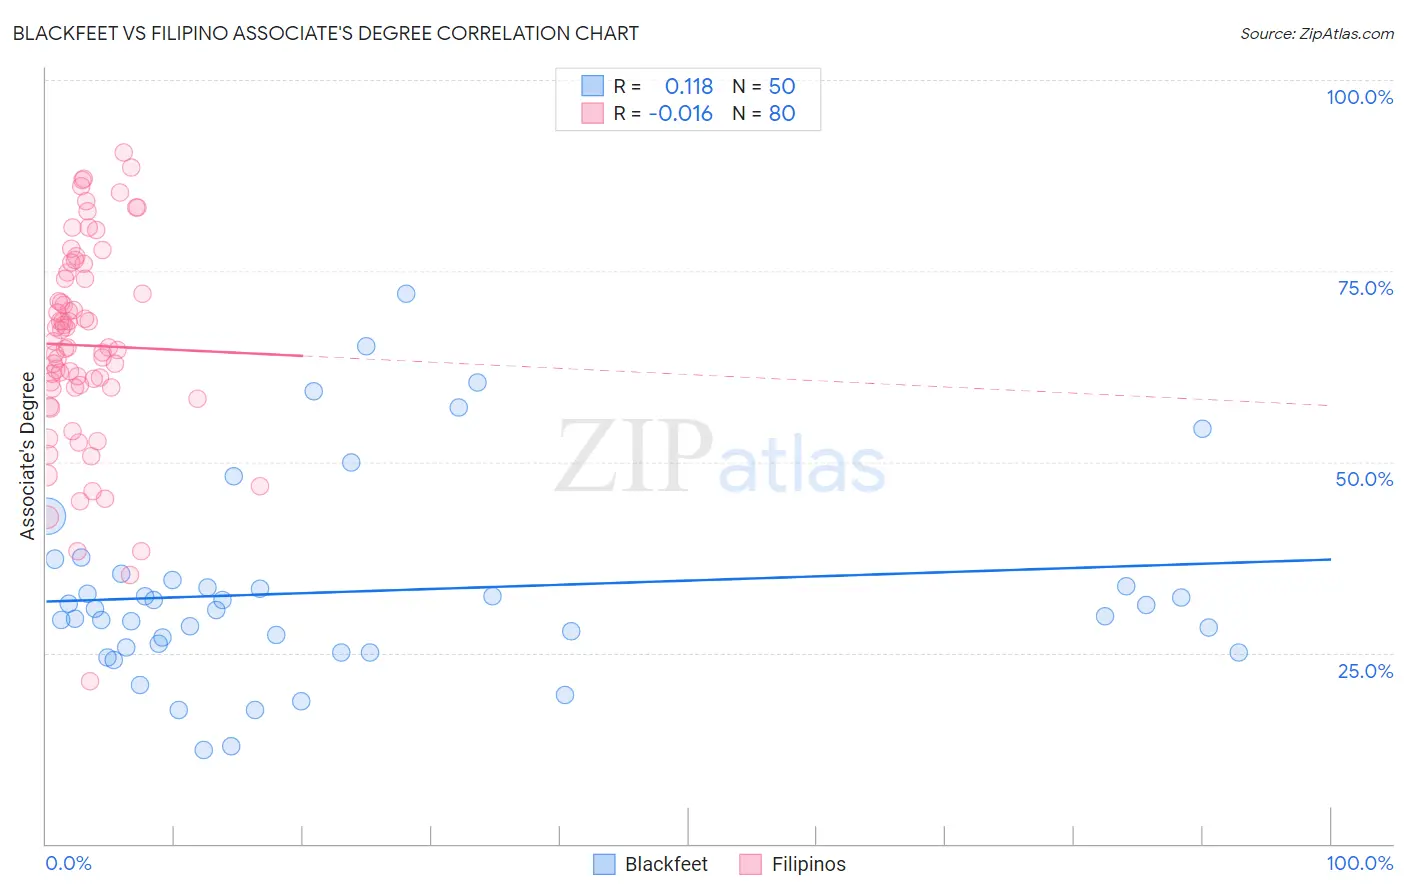
Blackfeet vs Filipino Associate's Degree Correlation Chart
The statistical analysis conducted on geographies consisting of 309,580,719 people shows a poor positive correlation between the proportion of Blackfeet and percentage of population with at least associate's degree education in the United States with a correlation coefficient (R) of 0.118 and weighted average of 40.3%. Similarly, the statistical analysis conducted on geographies consisting of 254,337,502 people shows no correlation between the proportion of Filipinos and percentage of population with at least associate's degree education in the United States with a correlation coefficient (R) of -0.016 and weighted average of 59.8%, a difference of 48.2%.
Associate's Degree Correlation Summary
| Measurement | Blackfeet | Filipino |
| Minimum | 12.2% | 21.2% |
| Maximum | 72.0% | 90.5% |
| Range | 59.8% | 69.3% |
| Mean | 33.0% | 65.3% |
| Median | 30.7% | 65.0% |
| Interquartile 25% (IQ1) | 25.7% | 59.7% |
| Interquartile 75% (IQ3) | 34.5% | 74.4% |
| Interquartile Range (IQR) | 8.8% | 14.7% |
| Standard Deviation (Sample) | 13.0% | 13.5% |
| Standard Deviation (Population) | 12.8% | 13.4% |
Similar Demographics by Associate's Degree
Demographics Similar to Blackfeet by Associate's Degree
In terms of associate's degree, the demographic groups most similar to Blackfeet are Puerto Rican (40.4%, a difference of 0.050%), Ottawa (40.3%, a difference of 0.15%), Potawatomi (40.4%, a difference of 0.16%), Immigrants from Nicaragua (40.3%, a difference of 0.19%), and Immigrants from Dominica (40.5%, a difference of 0.30%).
| Demographics | Rating | Rank | Associate's Degree |
| Chippewa | 0.2 /100 | #270 | Tragic 40.7% |
| Immigrants | Laos | 0.1 /100 | #271 | Tragic 40.7% |
| Belizeans | 0.1 /100 | #272 | Tragic 40.6% |
| Puget Sound Salish | 0.1 /100 | #273 | Tragic 40.5% |
| Immigrants | Dominica | 0.1 /100 | #274 | Tragic 40.5% |
| Potawatomi | 0.1 /100 | #275 | Tragic 40.4% |
| Puerto Ricans | 0.1 /100 | #276 | Tragic 40.4% |
| Blackfeet | 0.1 /100 | #277 | Tragic 40.3% |
| Ottawa | 0.1 /100 | #278 | Tragic 40.3% |
| Immigrants | Nicaragua | 0.1 /100 | #279 | Tragic 40.3% |
| Immigrants | Micronesia | 0.1 /100 | #280 | Tragic 40.2% |
| Immigrants | Portugal | 0.1 /100 | #281 | Tragic 40.1% |
| Bangladeshis | 0.1 /100 | #282 | Tragic 40.0% |
| Haitians | 0.1 /100 | #283 | Tragic 40.0% |
| Comanche | 0.1 /100 | #284 | Tragic 39.9% |
Demographics Similar to Filipinos by Associate's Degree
In terms of associate's degree, the demographic groups most similar to Filipinos are Immigrants from Singapore (58.9%, a difference of 1.5%), Immigrants from India (58.5%, a difference of 2.1%), Immigrants from Taiwan (58.4%, a difference of 2.4%), Iranian (58.2%, a difference of 2.8%), and Okinawan (57.7%, a difference of 3.7%).
| Demographics | Rating | Rank | Associate's Degree |
| Filipinos | 100.0 /100 | #1 | Exceptional 59.8% |
| Immigrants | Singapore | 100.0 /100 | #2 | Exceptional 58.9% |
| Immigrants | India | 100.0 /100 | #3 | Exceptional 58.5% |
| Immigrants | Taiwan | 100.0 /100 | #4 | Exceptional 58.4% |
| Iranians | 100.0 /100 | #5 | Exceptional 58.2% |
| Okinawans | 100.0 /100 | #6 | Exceptional 57.7% |
| Immigrants | Iran | 100.0 /100 | #7 | Exceptional 57.7% |
| Thais | 100.0 /100 | #8 | Exceptional 57.4% |
| Immigrants | Israel | 100.0 /100 | #9 | Exceptional 56.8% |
| Cypriots | 100.0 /100 | #10 | Exceptional 56.4% |
| Immigrants | Australia | 100.0 /100 | #11 | Exceptional 55.8% |
| Immigrants | South Central Asia | 100.0 /100 | #12 | Exceptional 55.7% |
| Immigrants | China | 100.0 /100 | #13 | Exceptional 55.5% |
| Immigrants | Hong Kong | 100.0 /100 | #14 | Exceptional 55.4% |
| Immigrants | Eastern Asia | 100.0 /100 | #15 | Exceptional 55.4% |