Apache vs Costa Rican Doctorate Degree
COMPARE
Apache
Costa Rican
Doctorate Degree
Doctorate Degree Comparison
Apache
Costa Ricans
1.5%
DOCTORATE DEGREE
1.3/ 100
METRIC RATING
251st/ 347
METRIC RANK
1.8%
DOCTORATE DEGREE
53.3/ 100
METRIC RATING
170th/ 347
METRIC RANK
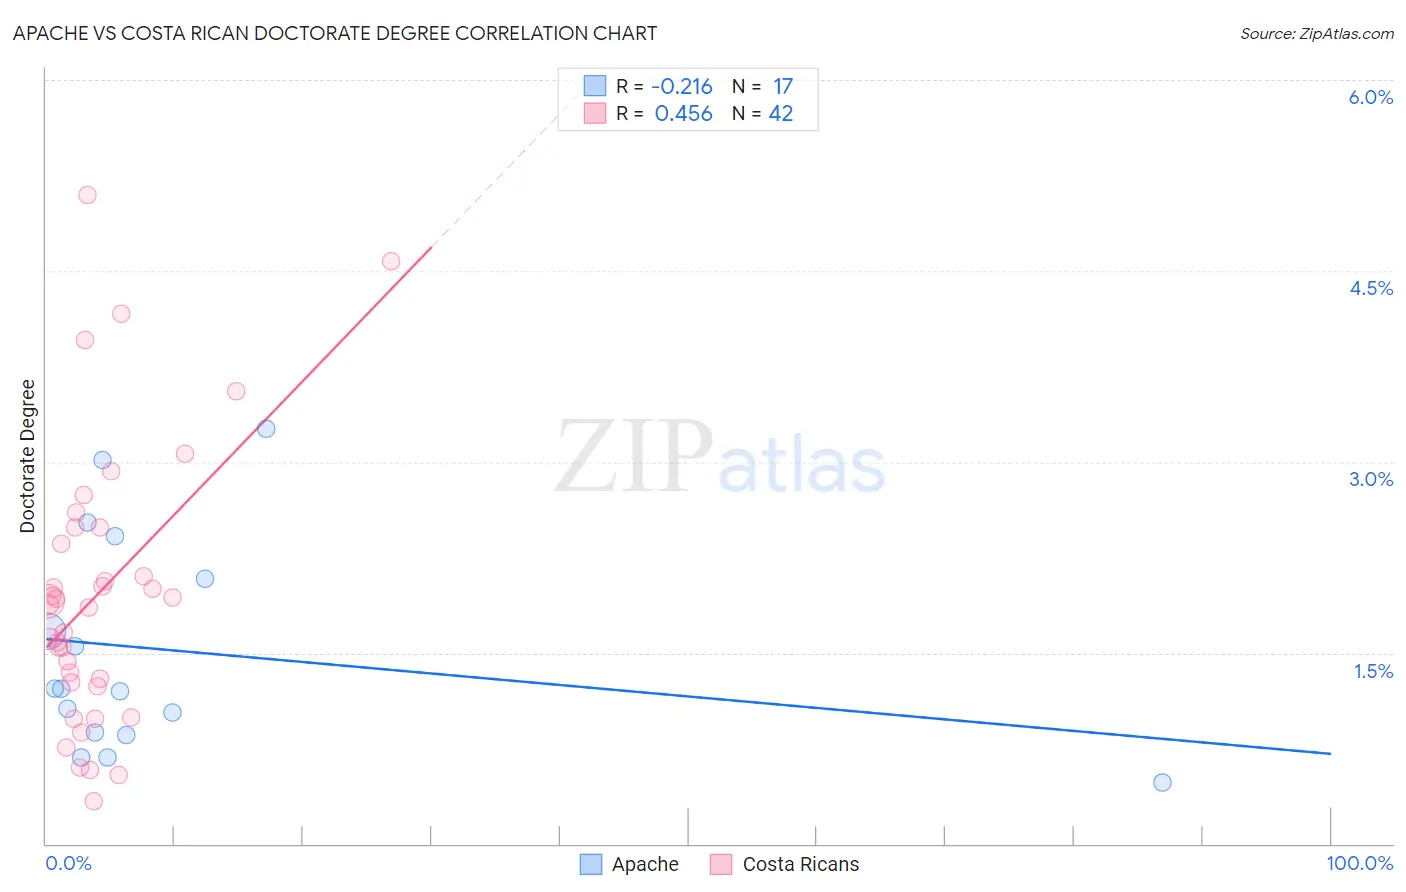
Apache vs Costa Rican Doctorate Degree Correlation Chart
The statistical analysis conducted on geographies consisting of 228,067,045 people shows a weak negative correlation between the proportion of Apache and percentage of population with at least doctorate degree education in the United States with a correlation coefficient (R) of -0.216 and weighted average of 1.5%. Similarly, the statistical analysis conducted on geographies consisting of 252,535,620 people shows a moderate positive correlation between the proportion of Costa Ricans and percentage of population with at least doctorate degree education in the United States with a correlation coefficient (R) of 0.456 and weighted average of 1.8%, a difference of 19.4%.
Doctorate Degree Correlation Summary
| Measurement | Apache | Costa Rican |
| Minimum | 0.48% | 0.34% |
| Maximum | 3.3% | 5.1% |
| Range | 2.8% | 4.8% |
| Mean | 1.5% | 2.0% |
| Median | 1.2% | 1.9% |
| Interquartile 25% (IQ1) | 0.86% | 1.3% |
| Interquartile 75% (IQ3) | 2.3% | 2.5% |
| Interquartile Range (IQR) | 1.4% | 1.2% |
| Standard Deviation (Sample) | 0.85% | 1.1% |
| Standard Deviation (Population) | 0.82% | 1.1% |
Similar Demographics by Doctorate Degree
Demographics Similar to Apache by Doctorate Degree
In terms of doctorate degree, the demographic groups most similar to Apache are Immigrants from Fiji (1.6%, a difference of 0.87%), Potawatomi (1.6%, a difference of 0.90%), Yuman (1.5%, a difference of 0.92%), American (1.5%, a difference of 1.1%), and Immigrants from Cambodia (1.5%, a difference of 1.2%).
| Demographics | Rating | Rank | Doctorate Degree |
| French American Indians | 2.0 /100 | #244 | Tragic 1.6% |
| Delaware | 1.9 /100 | #245 | Tragic 1.6% |
| Hmong | 1.8 /100 | #246 | Tragic 1.6% |
| Comanche | 1.8 /100 | #247 | Tragic 1.6% |
| Africans | 1.8 /100 | #248 | Tragic 1.6% |
| Potawatomi | 1.6 /100 | #249 | Tragic 1.6% |
| Immigrants | Fiji | 1.6 /100 | #250 | Tragic 1.6% |
| Apache | 1.3 /100 | #251 | Tragic 1.5% |
| Yuman | 1.1 /100 | #252 | Tragic 1.5% |
| Americans | 1.0 /100 | #253 | Tragic 1.5% |
| Immigrants | Cambodia | 1.0 /100 | #254 | Tragic 1.5% |
| Trinidadians and Tobagonians | 1.0 /100 | #255 | Tragic 1.5% |
| Central American Indians | 1.0 /100 | #256 | Tragic 1.5% |
| Chippewa | 0.9 /100 | #257 | Tragic 1.5% |
| Immigrants | West Indies | 0.9 /100 | #258 | Tragic 1.5% |
Demographics Similar to Costa Ricans by Doctorate Degree
In terms of doctorate degree, the demographic groups most similar to Costa Ricans are Bermudan (1.8%, a difference of 0.17%), Vietnamese (1.9%, a difference of 0.22%), Belgian (1.8%, a difference of 0.44%), Norwegian (1.8%, a difference of 0.48%), and Immigrants from Bangladesh (1.8%, a difference of 0.48%).
| Demographics | Rating | Rank | Doctorate Degree |
| Czechs | 67.3 /100 | #163 | Good 1.9% |
| Celtics | 66.7 /100 | #164 | Good 1.9% |
| Scotch-Irish | 63.6 /100 | #165 | Good 1.9% |
| Spaniards | 63.5 /100 | #166 | Good 1.9% |
| Macedonians | 60.9 /100 | #167 | Good 1.9% |
| Sri Lankans | 60.3 /100 | #168 | Good 1.9% |
| Vietnamese | 54.8 /100 | #169 | Average 1.9% |
| Costa Ricans | 53.3 /100 | #170 | Average 1.8% |
| Bermudans | 52.1 /100 | #171 | Average 1.8% |
| Belgians | 50.3 /100 | #172 | Average 1.8% |
| Norwegians | 50.0 /100 | #173 | Average 1.8% |
| Immigrants | Bangladesh | 50.0 /100 | #174 | Average 1.8% |
| Immigrants | Thailand | 49.4 /100 | #175 | Average 1.8% |
| Spanish | 49.3 /100 | #176 | Average 1.8% |
| Iraqis | 49.2 /100 | #177 | Average 1.8% |