Immigrants from Bahamas vs Costa Rican Doctorate Degree
COMPARE
Immigrants from Bahamas
Costa Rican
Doctorate Degree
Doctorate Degree Comparison
Immigrants from Bahamas
Costa Ricans
1.5%
DOCTORATE DEGREE
0.7/ 100
METRIC RATING
263rd/ 347
METRIC RANK
1.8%
DOCTORATE DEGREE
53.3/ 100
METRIC RATING
170th/ 347
METRIC RANK
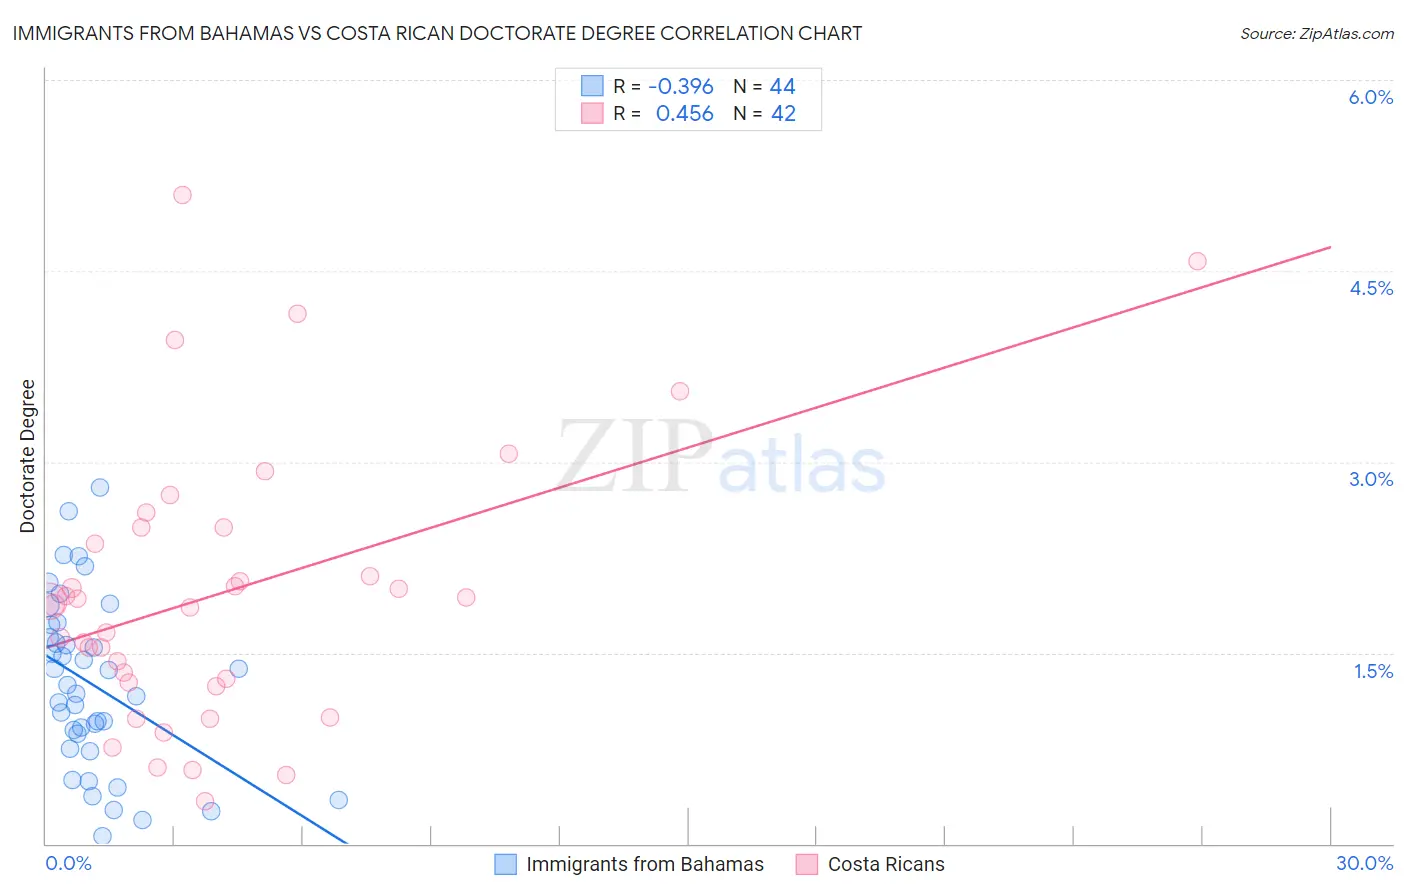
Immigrants from Bahamas vs Costa Rican Doctorate Degree Correlation Chart
The statistical analysis conducted on geographies consisting of 104,472,552 people shows a mild negative correlation between the proportion of Immigrants from Bahamas and percentage of population with at least doctorate degree education in the United States with a correlation coefficient (R) of -0.396 and weighted average of 1.5%. Similarly, the statistical analysis conducted on geographies consisting of 252,535,620 people shows a moderate positive correlation between the proportion of Costa Ricans and percentage of population with at least doctorate degree education in the United States with a correlation coefficient (R) of 0.456 and weighted average of 1.8%, a difference of 22.6%.
Doctorate Degree Correlation Summary
| Measurement | Immigrants from Bahamas | Costa Rican |
| Minimum | 0.056% | 0.34% |
| Maximum | 2.8% | 5.1% |
| Range | 2.7% | 4.8% |
| Mean | 1.2% | 2.0% |
| Median | 1.2% | 1.9% |
| Interquartile 25% (IQ1) | 0.80% | 1.3% |
| Interquartile 75% (IQ3) | 1.7% | 2.5% |
| Interquartile Range (IQR) | 0.87% | 1.2% |
| Standard Deviation (Sample) | 0.67% | 1.1% |
| Standard Deviation (Population) | 0.66% | 1.1% |
Similar Demographics by Doctorate Degree
Demographics Similar to Immigrants from Bahamas by Doctorate Degree
In terms of doctorate degree, the demographic groups most similar to Immigrants from Bahamas are Chickasaw (1.5%, a difference of 0.17%), Blackfeet (1.5%, a difference of 0.18%), Immigrants from Portugal (1.5%, a difference of 0.32%), Nicaraguan (1.5%, a difference of 0.47%), and Japanese (1.5%, a difference of 0.79%).
| Demographics | Rating | Rank | Doctorate Degree |
| Central American Indians | 1.0 /100 | #256 | Tragic 1.5% |
| Chippewa | 0.9 /100 | #257 | Tragic 1.5% |
| Immigrants | West Indies | 0.9 /100 | #258 | Tragic 1.5% |
| Liberians | 0.9 /100 | #259 | Tragic 1.5% |
| Japanese | 0.9 /100 | #260 | Tragic 1.5% |
| Immigrants | Portugal | 0.8 /100 | #261 | Tragic 1.5% |
| Chickasaw | 0.7 /100 | #262 | Tragic 1.5% |
| Immigrants | Bahamas | 0.7 /100 | #263 | Tragic 1.5% |
| Blackfeet | 0.7 /100 | #264 | Tragic 1.5% |
| Nicaraguans | 0.6 /100 | #265 | Tragic 1.5% |
| Immigrants | Liberia | 0.5 /100 | #266 | Tragic 1.5% |
| Kiowa | 0.5 /100 | #267 | Tragic 1.5% |
| U.S. Virgin Islanders | 0.5 /100 | #268 | Tragic 1.5% |
| Crow | 0.5 /100 | #269 | Tragic 1.5% |
| Salvadorans | 0.5 /100 | #270 | Tragic 1.5% |
Demographics Similar to Costa Ricans by Doctorate Degree
In terms of doctorate degree, the demographic groups most similar to Costa Ricans are Bermudan (1.8%, a difference of 0.17%), Vietnamese (1.9%, a difference of 0.22%), Belgian (1.8%, a difference of 0.44%), Norwegian (1.8%, a difference of 0.48%), and Immigrants from Bangladesh (1.8%, a difference of 0.48%).
| Demographics | Rating | Rank | Doctorate Degree |
| Czechs | 67.3 /100 | #163 | Good 1.9% |
| Celtics | 66.7 /100 | #164 | Good 1.9% |
| Scotch-Irish | 63.6 /100 | #165 | Good 1.9% |
| Spaniards | 63.5 /100 | #166 | Good 1.9% |
| Macedonians | 60.9 /100 | #167 | Good 1.9% |
| Sri Lankans | 60.3 /100 | #168 | Good 1.9% |
| Vietnamese | 54.8 /100 | #169 | Average 1.9% |
| Costa Ricans | 53.3 /100 | #170 | Average 1.8% |
| Bermudans | 52.1 /100 | #171 | Average 1.8% |
| Belgians | 50.3 /100 | #172 | Average 1.8% |
| Norwegians | 50.0 /100 | #173 | Average 1.8% |
| Immigrants | Bangladesh | 50.0 /100 | #174 | Average 1.8% |
| Immigrants | Thailand | 49.4 /100 | #175 | Average 1.8% |
| Spanish | 49.3 /100 | #176 | Average 1.8% |
| Iraqis | 49.2 /100 | #177 | Average 1.8% |