Immigrants from Ecuador vs Costa Rican Doctorate Degree
COMPARE
Immigrants from Ecuador
Costa Rican
Doctorate Degree
Doctorate Degree Comparison
Immigrants from Ecuador
Costa Ricans
1.4%
DOCTORATE DEGREE
0.2/ 100
METRIC RATING
296th/ 347
METRIC RANK
1.8%
DOCTORATE DEGREE
53.3/ 100
METRIC RATING
170th/ 347
METRIC RANK
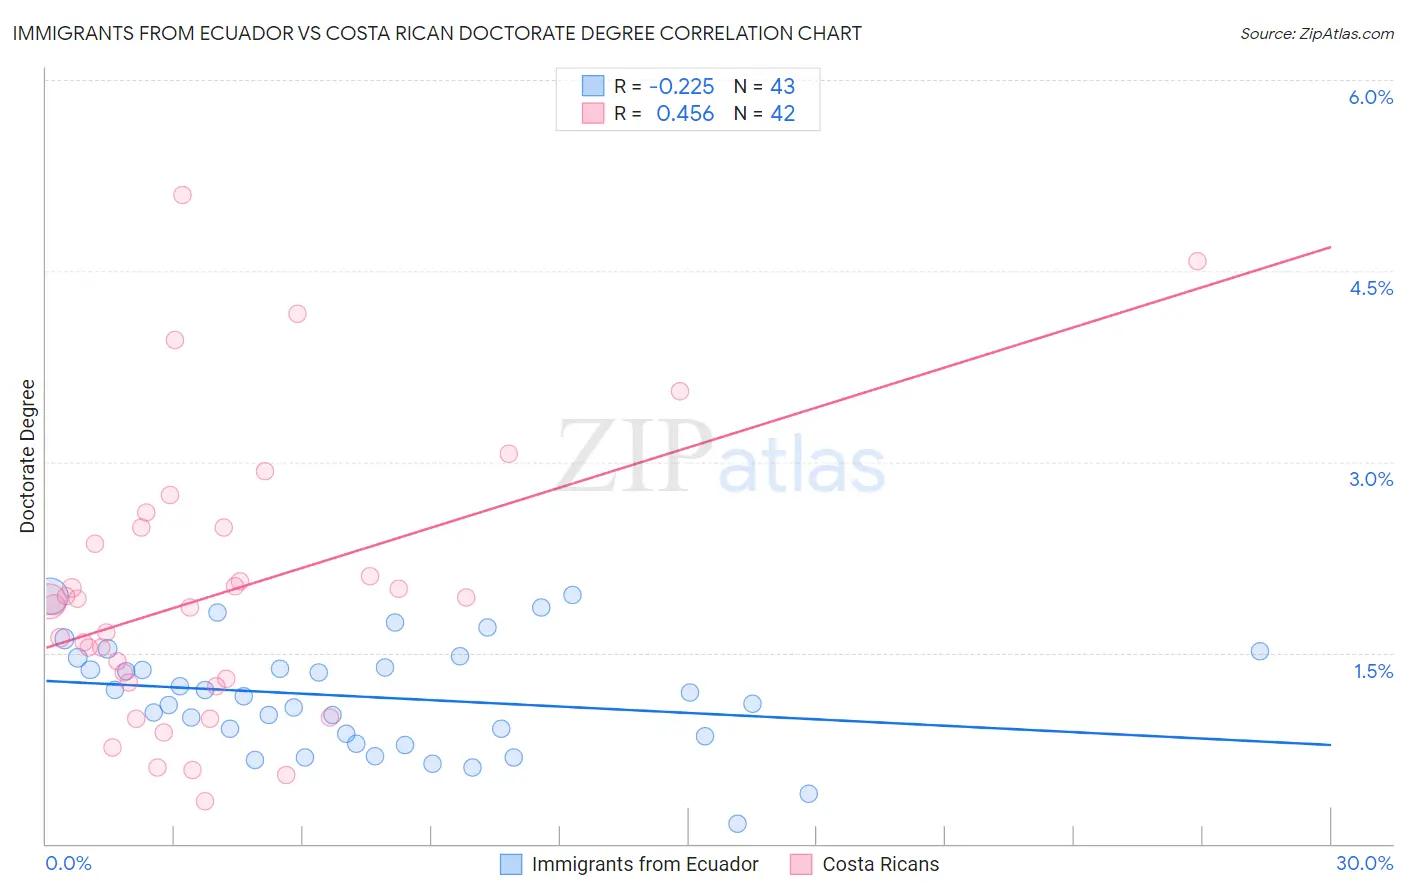
Immigrants from Ecuador vs Costa Rican Doctorate Degree Correlation Chart
The statistical analysis conducted on geographies consisting of 269,753,528 people shows a weak negative correlation between the proportion of Immigrants from Ecuador and percentage of population with at least doctorate degree education in the United States with a correlation coefficient (R) of -0.225 and weighted average of 1.4%. Similarly, the statistical analysis conducted on geographies consisting of 252,535,620 people shows a moderate positive correlation between the proportion of Costa Ricans and percentage of population with at least doctorate degree education in the United States with a correlation coefficient (R) of 0.456 and weighted average of 1.8%, a difference of 31.2%.
Doctorate Degree Correlation Summary
| Measurement | Immigrants from Ecuador | Costa Rican |
| Minimum | 0.16% | 0.34% |
| Maximum | 2.0% | 5.1% |
| Range | 1.8% | 4.8% |
| Mean | 1.2% | 2.0% |
| Median | 1.2% | 1.9% |
| Interquartile 25% (IQ1) | 0.84% | 1.3% |
| Interquartile 75% (IQ3) | 1.5% | 2.5% |
| Interquartile Range (IQR) | 0.62% | 1.2% |
| Standard Deviation (Sample) | 0.42% | 1.1% |
| Standard Deviation (Population) | 0.42% | 1.1% |
Similar Demographics by Doctorate Degree
Demographics Similar to Immigrants from Ecuador by Doctorate Degree
In terms of doctorate degree, the demographic groups most similar to Immigrants from Ecuador are Tsimshian (1.4%, a difference of 0.22%), Guatemalan (1.4%, a difference of 0.23%), Puerto Rican (1.4%, a difference of 0.63%), Samoan (1.4%, a difference of 0.94%), and Belizean (1.4%, a difference of 1.1%).
| Demographics | Rating | Rank | Doctorate Degree |
| Cape Verdeans | 0.3 /100 | #289 | Tragic 1.4% |
| Choctaw | 0.3 /100 | #290 | Tragic 1.4% |
| Blacks/African Americans | 0.3 /100 | #291 | Tragic 1.4% |
| Alaska Natives | 0.3 /100 | #292 | Tragic 1.4% |
| Immigrants | Yemen | 0.2 /100 | #293 | Tragic 1.4% |
| Samoans | 0.2 /100 | #294 | Tragic 1.4% |
| Guatemalans | 0.2 /100 | #295 | Tragic 1.4% |
| Immigrants | Ecuador | 0.2 /100 | #296 | Tragic 1.4% |
| Tsimshian | 0.2 /100 | #297 | Tragic 1.4% |
| Puerto Ricans | 0.1 /100 | #298 | Tragic 1.4% |
| Belizeans | 0.1 /100 | #299 | Tragic 1.4% |
| Immigrants | Guatemala | 0.1 /100 | #300 | Tragic 1.4% |
| Hondurans | 0.1 /100 | #301 | Tragic 1.4% |
| Shoshone | 0.1 /100 | #302 | Tragic 1.4% |
| Immigrants | Dominica | 0.1 /100 | #303 | Tragic 1.4% |
Demographics Similar to Costa Ricans by Doctorate Degree
In terms of doctorate degree, the demographic groups most similar to Costa Ricans are Bermudan (1.8%, a difference of 0.17%), Vietnamese (1.9%, a difference of 0.22%), Belgian (1.8%, a difference of 0.44%), Norwegian (1.8%, a difference of 0.48%), and Immigrants from Bangladesh (1.8%, a difference of 0.48%).
| Demographics | Rating | Rank | Doctorate Degree |
| Czechs | 67.3 /100 | #163 | Good 1.9% |
| Celtics | 66.7 /100 | #164 | Good 1.9% |
| Scotch-Irish | 63.6 /100 | #165 | Good 1.9% |
| Spaniards | 63.5 /100 | #166 | Good 1.9% |
| Macedonians | 60.9 /100 | #167 | Good 1.9% |
| Sri Lankans | 60.3 /100 | #168 | Good 1.9% |
| Vietnamese | 54.8 /100 | #169 | Average 1.9% |
| Costa Ricans | 53.3 /100 | #170 | Average 1.8% |
| Bermudans | 52.1 /100 | #171 | Average 1.8% |
| Belgians | 50.3 /100 | #172 | Average 1.8% |
| Norwegians | 50.0 /100 | #173 | Average 1.8% |
| Immigrants | Bangladesh | 50.0 /100 | #174 | Average 1.8% |
| Immigrants | Thailand | 49.4 /100 | #175 | Average 1.8% |
| Spanish | 49.3 /100 | #176 | Average 1.8% |
| Iraqis | 49.2 /100 | #177 | Average 1.8% |