Apache vs Costa Rican Single Father Households
COMPARE
Apache
Costa Rican
Single Father Households
Single Father Households Comparison
Apache
Costa Ricans
2.8%
SINGLE FATHER HOUSEHOLDS
0.0/ 100
METRIC RATING
308th/ 347
METRIC RANK
2.3%
SINGLE FATHER HOUSEHOLDS
44.1/ 100
METRIC RATING
178th/ 347
METRIC RANK
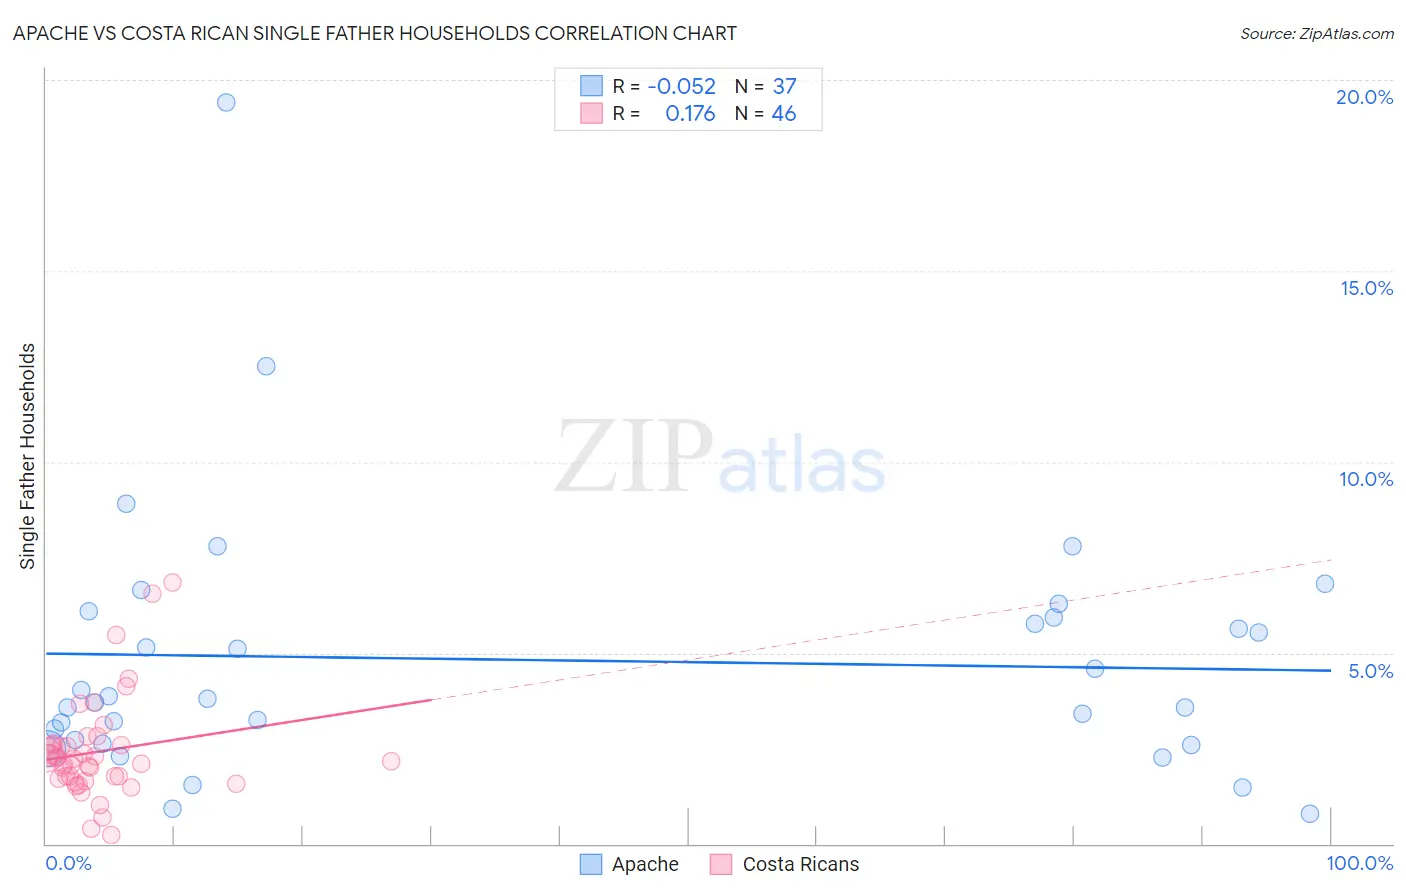
Apache vs Costa Rican Single Father Households Correlation Chart
The statistical analysis conducted on geographies consisting of 230,074,281 people shows a slight negative correlation between the proportion of Apache and percentage of single father households in the United States with a correlation coefficient (R) of -0.052 and weighted average of 2.8%. Similarly, the statistical analysis conducted on geographies consisting of 252,556,792 people shows a poor positive correlation between the proportion of Costa Ricans and percentage of single father households in the United States with a correlation coefficient (R) of 0.176 and weighted average of 2.3%, a difference of 20.7%.
Single Father Households Correlation Summary
| Measurement | Apache | Costa Rican |
| Minimum | 0.80% | 0.25% |
| Maximum | 19.4% | 6.9% |
| Range | 18.6% | 6.6% |
| Mean | 4.8% | 2.4% |
| Median | 3.8% | 2.2% |
| Interquartile 25% (IQ1) | 2.7% | 1.7% |
| Interquartile 75% (IQ3) | 6.0% | 2.6% |
| Interquartile Range (IQR) | 3.3% | 0.87% |
| Standard Deviation (Sample) | 3.4% | 1.3% |
| Standard Deviation (Population) | 3.4% | 1.3% |
Similar Demographics by Single Father Households
Demographics Similar to Apache by Single Father Households
In terms of single father households, the demographic groups most similar to Apache are Hopi (2.8%, a difference of 0.18%), Immigrants from the Azores (2.8%, a difference of 0.35%), Hispanic or Latino (2.8%, a difference of 0.50%), Mexican American Indian (2.8%, a difference of 0.66%), and Central American (2.9%, a difference of 0.71%).
| Demographics | Rating | Rank | Single Father Households |
| Immigrants | Latin America | 0.0 /100 | #301 | Tragic 2.8% |
| Spanish Americans | 0.0 /100 | #302 | Tragic 2.8% |
| Immigrants | Honduras | 0.0 /100 | #303 | Tragic 2.8% |
| Mexican American Indians | 0.0 /100 | #304 | Tragic 2.8% |
| Hispanics or Latinos | 0.0 /100 | #305 | Tragic 2.8% |
| Immigrants | Azores | 0.0 /100 | #306 | Tragic 2.8% |
| Hopi | 0.0 /100 | #307 | Tragic 2.8% |
| Apache | 0.0 /100 | #308 | Tragic 2.8% |
| Central Americans | 0.0 /100 | #309 | Tragic 2.9% |
| Immigrants | Laos | 0.0 /100 | #310 | Tragic 2.9% |
| Spanish American Indians | 0.0 /100 | #311 | Tragic 2.9% |
| Tsimshian | 0.0 /100 | #312 | Tragic 2.9% |
| Arapaho | 0.0 /100 | #313 | Tragic 2.9% |
| Salvadorans | 0.0 /100 | #314 | Tragic 2.9% |
| Cheyenne | 0.0 /100 | #315 | Tragic 2.9% |
Demographics Similar to Costa Ricans by Single Father Households
In terms of single father households, the demographic groups most similar to Costa Ricans are Welsh (2.3%, a difference of 0.0%), Yugoslavian (2.3%, a difference of 0.020%), Jamaican (2.3%, a difference of 0.040%), Belgian (2.3%, a difference of 0.060%), and Immigrants from Panama (2.4%, a difference of 0.17%).
| Demographics | Rating | Rank | Single Father Households |
| Swedes | 61.6 /100 | #171 | Good 2.3% |
| Czechoslovakians | 58.9 /100 | #172 | Average 2.3% |
| Celtics | 55.4 /100 | #173 | Average 2.3% |
| Afghans | 50.0 /100 | #174 | Average 2.3% |
| Immigrants | Jamaica | 49.1 /100 | #175 | Average 2.3% |
| Danes | 48.2 /100 | #176 | Average 2.3% |
| Colombians | 48.0 /100 | #177 | Average 2.3% |
| Costa Ricans | 44.1 /100 | #178 | Average 2.3% |
| Welsh | 44.0 /100 | #179 | Average 2.3% |
| Yugoslavians | 43.9 /100 | #180 | Average 2.3% |
| Jamaicans | 43.5 /100 | #181 | Average 2.3% |
| Belgians | 43.3 /100 | #182 | Average 2.3% |
| Immigrants | Panama | 41.8 /100 | #183 | Average 2.4% |
| Sri Lankans | 41.8 /100 | #184 | Average 2.4% |
| Nigerians | 41.0 /100 | #185 | Average 2.4% |