Apache vs Immigrants from Dominica Doctorate Degree
COMPARE
Apache
Immigrants from Dominica
Doctorate Degree
Doctorate Degree Comparison
Apache
Immigrants from Dominica
1.5%
DOCTORATE DEGREE
1.3/ 100
METRIC RATING
251st/ 347
METRIC RANK
1.4%
DOCTORATE DEGREE
0.1/ 100
METRIC RATING
303rd/ 347
METRIC RANK
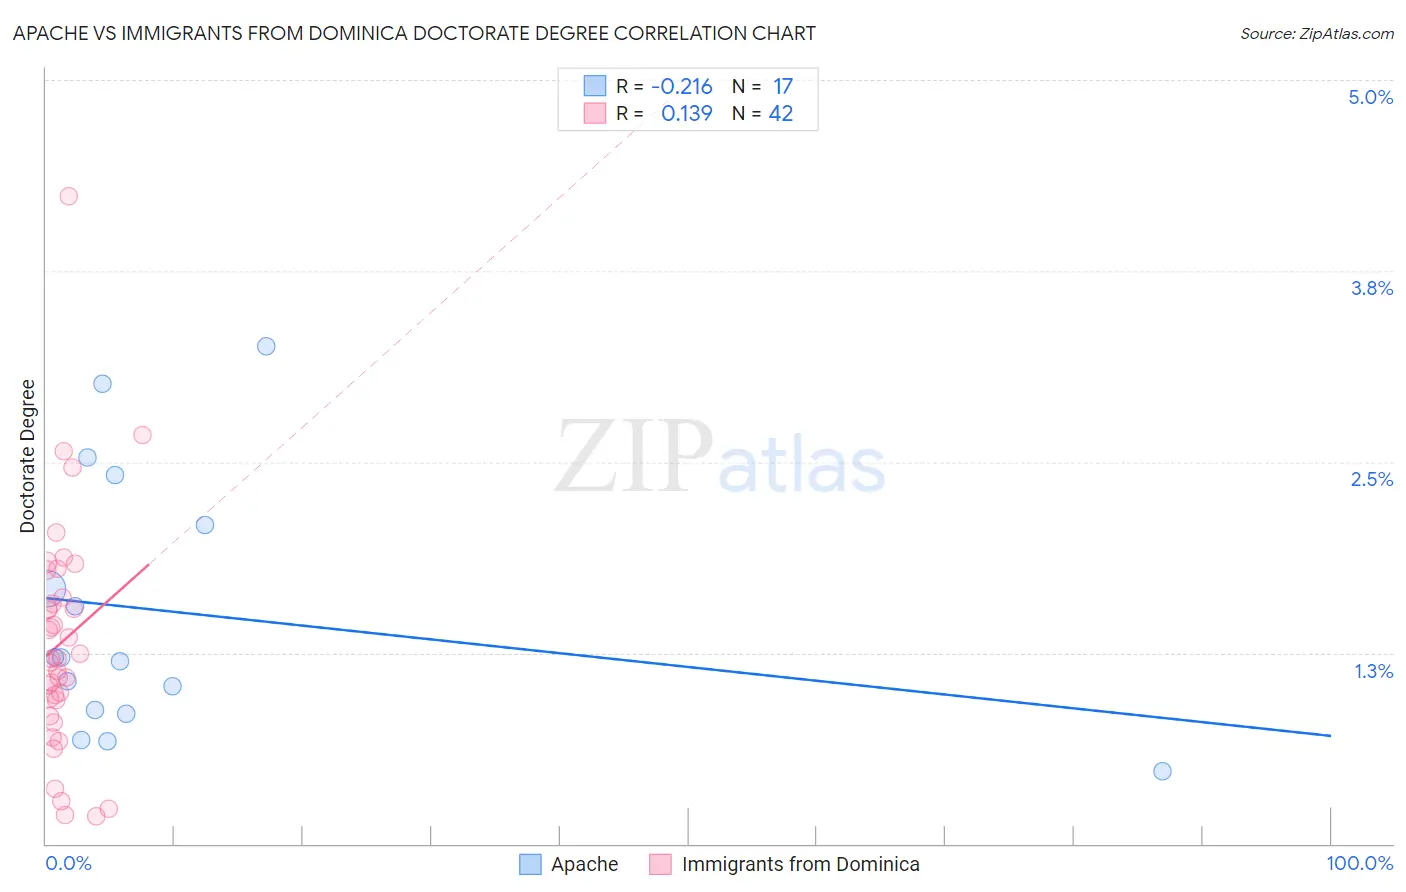
Apache vs Immigrants from Dominica Doctorate Degree Correlation Chart
The statistical analysis conducted on geographies consisting of 228,067,045 people shows a weak negative correlation between the proportion of Apache and percentage of population with at least doctorate degree education in the United States with a correlation coefficient (R) of -0.216 and weighted average of 1.5%. Similarly, the statistical analysis conducted on geographies consisting of 83,662,569 people shows a poor positive correlation between the proportion of Immigrants from Dominica and percentage of population with at least doctorate degree education in the United States with a correlation coefficient (R) of 0.139 and weighted average of 1.4%, a difference of 11.9%.
Doctorate Degree Correlation Summary
| Measurement | Apache | Immigrants from Dominica |
| Minimum | 0.48% | 0.18% |
| Maximum | 3.3% | 4.2% |
| Range | 2.8% | 4.1% |
| Mean | 1.5% | 1.3% |
| Median | 1.2% | 1.2% |
| Interquartile 25% (IQ1) | 0.86% | 0.94% |
| Interquartile 75% (IQ3) | 2.3% | 1.6% |
| Interquartile Range (IQR) | 1.4% | 0.67% |
| Standard Deviation (Sample) | 0.85% | 0.76% |
| Standard Deviation (Population) | 0.82% | 0.75% |
Similar Demographics by Doctorate Degree
Demographics Similar to Apache by Doctorate Degree
In terms of doctorate degree, the demographic groups most similar to Apache are Immigrants from Fiji (1.6%, a difference of 0.87%), Potawatomi (1.6%, a difference of 0.90%), Yuman (1.5%, a difference of 0.92%), American (1.5%, a difference of 1.1%), and Immigrants from Cambodia (1.5%, a difference of 1.2%).
| Demographics | Rating | Rank | Doctorate Degree |
| French American Indians | 2.0 /100 | #244 | Tragic 1.6% |
| Delaware | 1.9 /100 | #245 | Tragic 1.6% |
| Hmong | 1.8 /100 | #246 | Tragic 1.6% |
| Comanche | 1.8 /100 | #247 | Tragic 1.6% |
| Africans | 1.8 /100 | #248 | Tragic 1.6% |
| Potawatomi | 1.6 /100 | #249 | Tragic 1.6% |
| Immigrants | Fiji | 1.6 /100 | #250 | Tragic 1.6% |
| Apache | 1.3 /100 | #251 | Tragic 1.5% |
| Yuman | 1.1 /100 | #252 | Tragic 1.5% |
| Americans | 1.0 /100 | #253 | Tragic 1.5% |
| Immigrants | Cambodia | 1.0 /100 | #254 | Tragic 1.5% |
| Trinidadians and Tobagonians | 1.0 /100 | #255 | Tragic 1.5% |
| Central American Indians | 1.0 /100 | #256 | Tragic 1.5% |
| Chippewa | 0.9 /100 | #257 | Tragic 1.5% |
| Immigrants | West Indies | 0.9 /100 | #258 | Tragic 1.5% |
Demographics Similar to Immigrants from Dominica by Doctorate Degree
In terms of doctorate degree, the demographic groups most similar to Immigrants from Dominica are Shoshone (1.4%, a difference of 0.030%), Mexican American Indian (1.4%, a difference of 0.060%), Pennsylvania German (1.4%, a difference of 0.19%), Guyanese (1.4%, a difference of 0.20%), and Honduran (1.4%, a difference of 0.36%).
| Demographics | Rating | Rank | Doctorate Degree |
| Immigrants | Ecuador | 0.2 /100 | #296 | Tragic 1.4% |
| Tsimshian | 0.2 /100 | #297 | Tragic 1.4% |
| Puerto Ricans | 0.1 /100 | #298 | Tragic 1.4% |
| Belizeans | 0.1 /100 | #299 | Tragic 1.4% |
| Immigrants | Guatemala | 0.1 /100 | #300 | Tragic 1.4% |
| Hondurans | 0.1 /100 | #301 | Tragic 1.4% |
| Shoshone | 0.1 /100 | #302 | Tragic 1.4% |
| Immigrants | Dominica | 0.1 /100 | #303 | Tragic 1.4% |
| Mexican American Indians | 0.1 /100 | #304 | Tragic 1.4% |
| Pennsylvania Germans | 0.1 /100 | #305 | Tragic 1.4% |
| Guyanese | 0.1 /100 | #306 | Tragic 1.4% |
| Cubans | 0.1 /100 | #307 | Tragic 1.4% |
| Immigrants | Laos | 0.1 /100 | #308 | Tragic 1.4% |
| Immigrants | Grenada | 0.1 /100 | #309 | Tragic 1.4% |
| Immigrants | Jamaica | 0.1 /100 | #310 | Tragic 1.4% |