Apache vs Immigrants from Dominican Republic Doctorate Degree
COMPARE
Apache
Immigrants from Dominican Republic
Doctorate Degree
Doctorate Degree Comparison
Apache
Immigrants from Dominican Republic
1.5%
DOCTORATE DEGREE
1.3/ 100
METRIC RATING
251st/ 347
METRIC RANK
1.3%
DOCTORATE DEGREE
0.0/ 100
METRIC RATING
334th/ 347
METRIC RANK
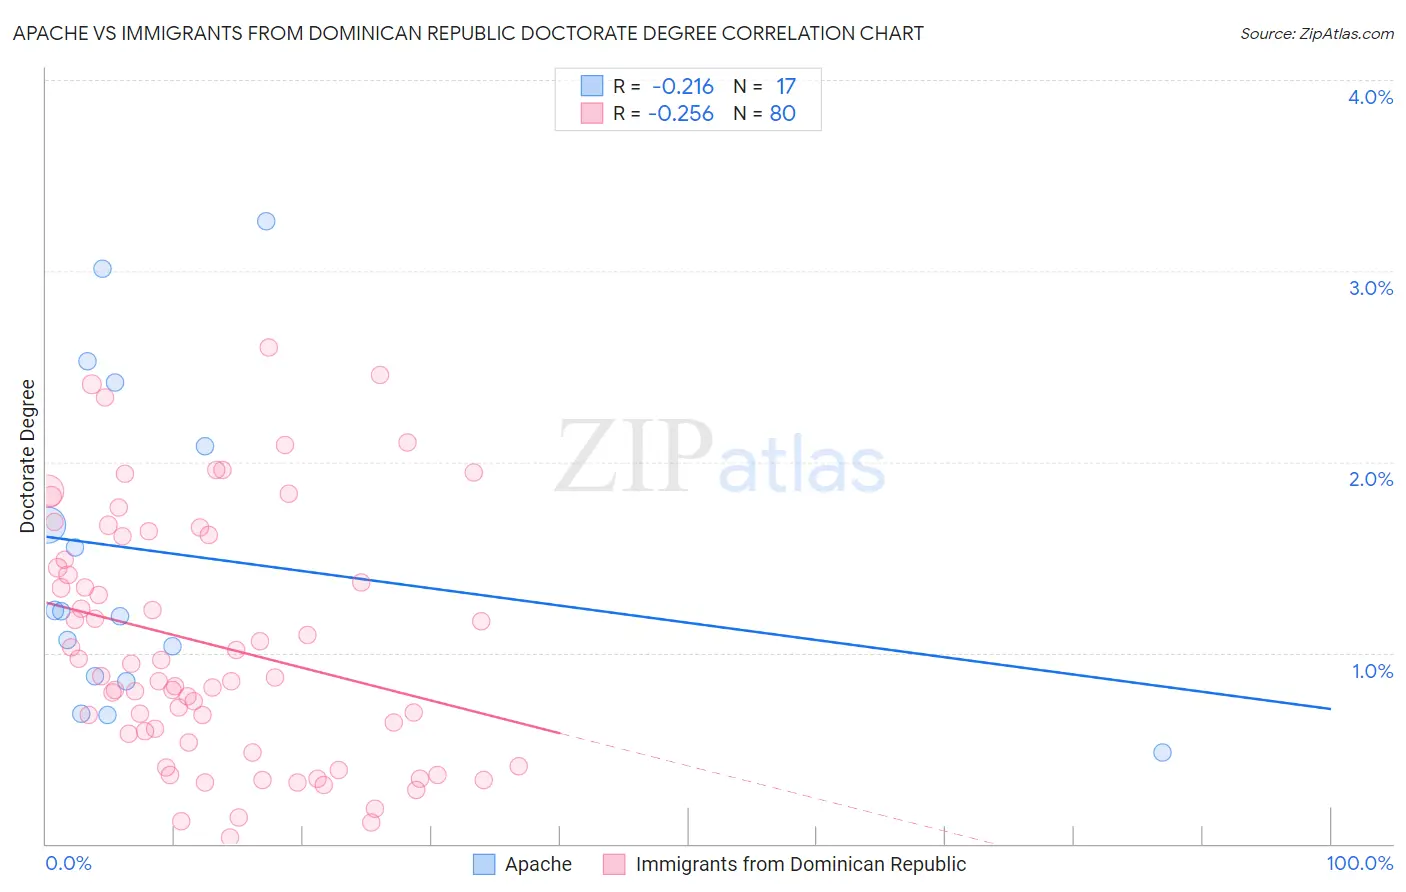
Apache vs Immigrants from Dominican Republic Doctorate Degree Correlation Chart
The statistical analysis conducted on geographies consisting of 228,067,045 people shows a weak negative correlation between the proportion of Apache and percentage of population with at least doctorate degree education in the United States with a correlation coefficient (R) of -0.216 and weighted average of 1.5%. Similarly, the statistical analysis conducted on geographies consisting of 273,260,616 people shows a weak negative correlation between the proportion of Immigrants from Dominican Republic and percentage of population with at least doctorate degree education in the United States with a correlation coefficient (R) of -0.256 and weighted average of 1.3%, a difference of 21.0%.
Doctorate Degree Correlation Summary
| Measurement | Apache | Immigrants from Dominican Republic |
| Minimum | 0.48% | 0.033% |
| Maximum | 3.3% | 2.6% |
| Range | 2.8% | 2.6% |
| Mean | 1.5% | 1.0% |
| Median | 1.2% | 0.87% |
| Interquartile 25% (IQ1) | 0.86% | 0.56% |
| Interquartile 75% (IQ3) | 2.3% | 1.5% |
| Interquartile Range (IQR) | 1.4% | 0.99% |
| Standard Deviation (Sample) | 0.85% | 0.64% |
| Standard Deviation (Population) | 0.82% | 0.64% |
Similar Demographics by Doctorate Degree
Demographics Similar to Apache by Doctorate Degree
In terms of doctorate degree, the demographic groups most similar to Apache are Immigrants from Fiji (1.6%, a difference of 0.87%), Potawatomi (1.6%, a difference of 0.90%), Yuman (1.5%, a difference of 0.92%), American (1.5%, a difference of 1.1%), and Immigrants from Cambodia (1.5%, a difference of 1.2%).
| Demographics | Rating | Rank | Doctorate Degree |
| French American Indians | 2.0 /100 | #244 | Tragic 1.6% |
| Delaware | 1.9 /100 | #245 | Tragic 1.6% |
| Hmong | 1.8 /100 | #246 | Tragic 1.6% |
| Comanche | 1.8 /100 | #247 | Tragic 1.6% |
| Africans | 1.8 /100 | #248 | Tragic 1.6% |
| Potawatomi | 1.6 /100 | #249 | Tragic 1.6% |
| Immigrants | Fiji | 1.6 /100 | #250 | Tragic 1.6% |
| Apache | 1.3 /100 | #251 | Tragic 1.5% |
| Yuman | 1.1 /100 | #252 | Tragic 1.5% |
| Americans | 1.0 /100 | #253 | Tragic 1.5% |
| Immigrants | Cambodia | 1.0 /100 | #254 | Tragic 1.5% |
| Trinidadians and Tobagonians | 1.0 /100 | #255 | Tragic 1.5% |
| Central American Indians | 1.0 /100 | #256 | Tragic 1.5% |
| Chippewa | 0.9 /100 | #257 | Tragic 1.5% |
| Immigrants | West Indies | 0.9 /100 | #258 | Tragic 1.5% |
Demographics Similar to Immigrants from Dominican Republic by Doctorate Degree
In terms of doctorate degree, the demographic groups most similar to Immigrants from Dominican Republic are Immigrants from Caribbean (1.3%, a difference of 0.19%), Yakama (1.3%, a difference of 0.35%), Immigrants from Haiti (1.3%, a difference of 1.8%), Immigrants from Latin America (1.3%, a difference of 1.9%), and Yup'ik (1.3%, a difference of 1.9%).
| Demographics | Rating | Rank | Doctorate Degree |
| Hispanics or Latinos | 0.0 /100 | #327 | Tragic 1.3% |
| Inupiat | 0.0 /100 | #328 | Tragic 1.3% |
| Haitians | 0.0 /100 | #329 | Tragic 1.3% |
| Yup'ik | 0.0 /100 | #330 | Tragic 1.3% |
| Immigrants | Latin America | 0.0 /100 | #331 | Tragic 1.3% |
| Yakama | 0.0 /100 | #332 | Tragic 1.3% |
| Immigrants | Caribbean | 0.0 /100 | #333 | Tragic 1.3% |
| Immigrants | Dominican Republic | 0.0 /100 | #334 | Tragic 1.3% |
| Immigrants | Haiti | 0.0 /100 | #335 | Tragic 1.3% |
| Nepalese | 0.0 /100 | #336 | Tragic 1.3% |
| Bangladeshis | 0.0 /100 | #337 | Tragic 1.2% |
| Puget Sound Salish | 0.0 /100 | #338 | Tragic 1.2% |
| Immigrants | Central America | 0.0 /100 | #339 | Tragic 1.2% |
| Immigrants | Cuba | 0.0 /100 | #340 | Tragic 1.2% |
| Mexicans | 0.0 /100 | #341 | Tragic 1.2% |