Spanish American vs Costa Rican Doctorate Degree
COMPARE
Spanish American
Costa Rican
Doctorate Degree
Doctorate Degree Comparison
Spanish Americans
Costa Ricans
1.7%
DOCTORATE DEGREE
12.9/ 100
METRIC RATING
217th/ 347
METRIC RANK
1.8%
DOCTORATE DEGREE
53.3/ 100
METRIC RATING
170th/ 347
METRIC RANK
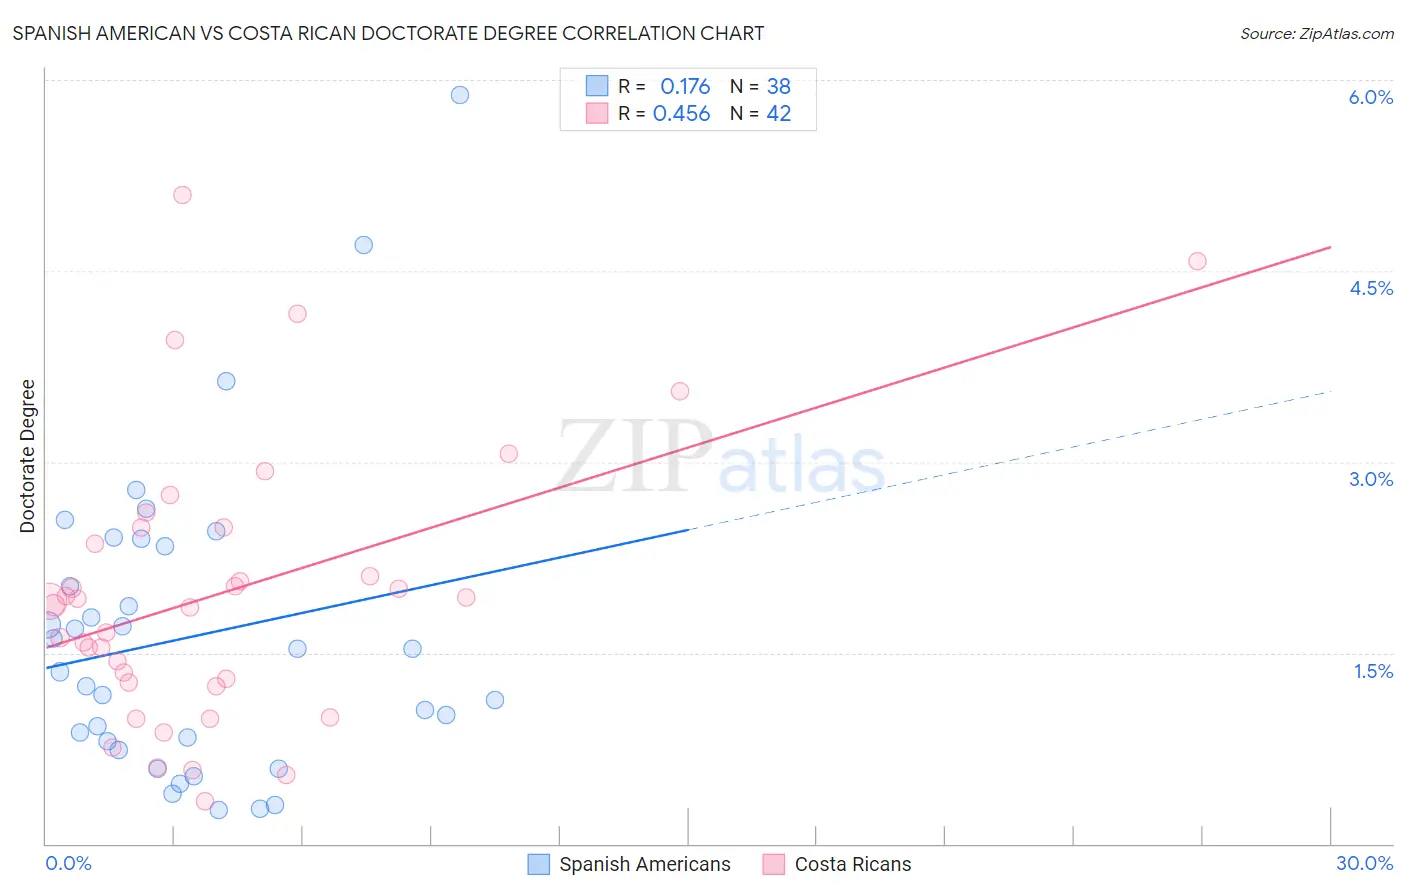
Spanish American vs Costa Rican Doctorate Degree Correlation Chart
The statistical analysis conducted on geographies consisting of 102,813,703 people shows a poor positive correlation between the proportion of Spanish Americans and percentage of population with at least doctorate degree education in the United States with a correlation coefficient (R) of 0.176 and weighted average of 1.7%. Similarly, the statistical analysis conducted on geographies consisting of 252,535,620 people shows a moderate positive correlation between the proportion of Costa Ricans and percentage of population with at least doctorate degree education in the United States with a correlation coefficient (R) of 0.456 and weighted average of 1.8%, a difference of 8.1%.
Doctorate Degree Correlation Summary
| Measurement | Spanish American | Costa Rican |
| Minimum | 0.26% | 0.34% |
| Maximum | 5.9% | 5.1% |
| Range | 5.6% | 4.8% |
| Mean | 1.6% | 2.0% |
| Median | 1.4% | 1.9% |
| Interquartile 25% (IQ1) | 0.80% | 1.3% |
| Interquartile 75% (IQ3) | 2.3% | 2.5% |
| Interquartile Range (IQR) | 1.5% | 1.2% |
| Standard Deviation (Sample) | 1.2% | 1.1% |
| Standard Deviation (Population) | 1.2% | 1.1% |
Similar Demographics by Doctorate Degree
Demographics Similar to Spanish Americans by Doctorate Degree
In terms of doctorate degree, the demographic groups most similar to Spanish Americans are Immigrants from Burma/Myanmar (1.7%, a difference of 0.21%), Alaskan Athabascan (1.7%, a difference of 0.31%), Tlingit-Haida (1.7%, a difference of 0.37%), Korean (1.7%, a difference of 0.45%), and Pueblo (1.7%, a difference of 0.45%).
| Demographics | Rating | Rank | Doctorate Degree |
| Tongans | 15.1 /100 | #210 | Poor 1.7% |
| Immigrants | Armenia | 15.1 /100 | #211 | Poor 1.7% |
| Immigrants | South Eastern Asia | 14.7 /100 | #212 | Poor 1.7% |
| Koreans | 14.2 /100 | #213 | Poor 1.7% |
| Pueblo | 14.2 /100 | #214 | Poor 1.7% |
| Alaskan Athabascans | 13.8 /100 | #215 | Poor 1.7% |
| Immigrants | Burma/Myanmar | 13.5 /100 | #216 | Poor 1.7% |
| Spanish Americans | 12.9 /100 | #217 | Poor 1.7% |
| Tlingit-Haida | 11.9 /100 | #218 | Poor 1.7% |
| Immigrants | Iraq | 10.7 /100 | #219 | Poor 1.7% |
| Immigrants | Uruguay | 9.2 /100 | #220 | Tragic 1.7% |
| Immigrants | Nonimmigrants | 8.8 /100 | #221 | Tragic 1.7% |
| Immigrants | Venezuela | 8.7 /100 | #222 | Tragic 1.7% |
| Immigrants | Bosnia and Herzegovina | 7.8 /100 | #223 | Tragic 1.7% |
| Immigrants | Poland | 7.4 /100 | #224 | Tragic 1.7% |
Demographics Similar to Costa Ricans by Doctorate Degree
In terms of doctorate degree, the demographic groups most similar to Costa Ricans are Bermudan (1.8%, a difference of 0.17%), Vietnamese (1.9%, a difference of 0.22%), Belgian (1.8%, a difference of 0.44%), Norwegian (1.8%, a difference of 0.48%), and Immigrants from Bangladesh (1.8%, a difference of 0.48%).
| Demographics | Rating | Rank | Doctorate Degree |
| Czechs | 67.3 /100 | #163 | Good 1.9% |
| Celtics | 66.7 /100 | #164 | Good 1.9% |
| Scotch-Irish | 63.6 /100 | #165 | Good 1.9% |
| Spaniards | 63.5 /100 | #166 | Good 1.9% |
| Macedonians | 60.9 /100 | #167 | Good 1.9% |
| Sri Lankans | 60.3 /100 | #168 | Good 1.9% |
| Vietnamese | 54.8 /100 | #169 | Average 1.9% |
| Costa Ricans | 53.3 /100 | #170 | Average 1.8% |
| Bermudans | 52.1 /100 | #171 | Average 1.8% |
| Belgians | 50.3 /100 | #172 | Average 1.8% |
| Norwegians | 50.0 /100 | #173 | Average 1.8% |
| Immigrants | Bangladesh | 50.0 /100 | #174 | Average 1.8% |
| Immigrants | Thailand | 49.4 /100 | #175 | Average 1.8% |
| Spanish | 49.3 /100 | #176 | Average 1.8% |
| Iraqis | 49.2 /100 | #177 | Average 1.8% |