Immigrants from Kenya vs Costa Rican Doctorate Degree
COMPARE
Immigrants from Kenya
Costa Rican
Doctorate Degree
Doctorate Degree Comparison
Immigrants from Kenya
Costa Ricans
1.9%
DOCTORATE DEGREE
74.3/ 100
METRIC RATING
152nd/ 347
METRIC RANK
1.8%
DOCTORATE DEGREE
53.3/ 100
METRIC RATING
170th/ 347
METRIC RANK
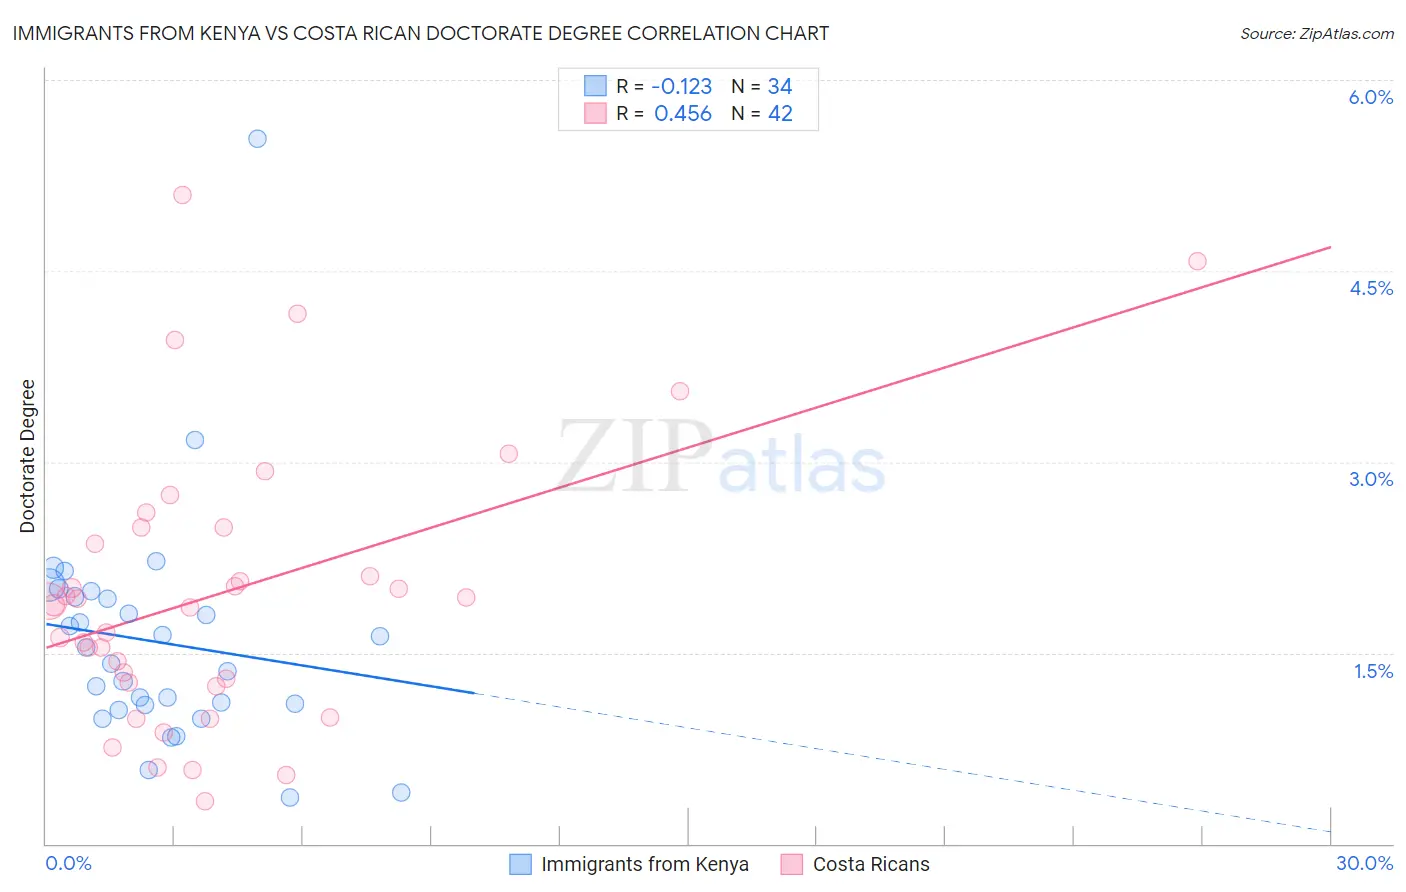
Immigrants from Kenya vs Costa Rican Doctorate Degree Correlation Chart
The statistical analysis conducted on geographies consisting of 217,428,476 people shows a poor negative correlation between the proportion of Immigrants from Kenya and percentage of population with at least doctorate degree education in the United States with a correlation coefficient (R) of -0.123 and weighted average of 1.9%. Similarly, the statistical analysis conducted on geographies consisting of 252,535,620 people shows a moderate positive correlation between the proportion of Costa Ricans and percentage of population with at least doctorate degree education in the United States with a correlation coefficient (R) of 0.456 and weighted average of 1.8%, a difference of 3.4%.
Doctorate Degree Correlation Summary
| Measurement | Immigrants from Kenya | Costa Rican |
| Minimum | 0.36% | 0.34% |
| Maximum | 5.5% | 5.1% |
| Range | 5.2% | 4.8% |
| Mean | 1.6% | 2.0% |
| Median | 1.5% | 1.9% |
| Interquartile 25% (IQ1) | 1.1% | 1.3% |
| Interquartile 75% (IQ3) | 1.9% | 2.5% |
| Interquartile Range (IQR) | 0.85% | 1.2% |
| Standard Deviation (Sample) | 0.91% | 1.1% |
| Standard Deviation (Population) | 0.90% | 1.1% |
Demographics Similar to Immigrants from Kenya and Costa Ricans by Doctorate Degree
In terms of doctorate degree, the demographic groups most similar to Immigrants from Kenya are Immigrants from Oceania (1.9%, a difference of 0.050%), Albanian (1.9%, a difference of 0.10%), Immigrants from Albania (1.9%, a difference of 0.27%), Polish (1.9%, a difference of 0.29%), and Slavic (1.9%, a difference of 0.35%). Similarly, the demographic groups most similar to Costa Ricans are Bermudan (1.8%, a difference of 0.17%), Vietnamese (1.9%, a difference of 0.22%), Sri Lankan (1.9%, a difference of 1.0%), Macedonian (1.9%, a difference of 1.1%), and Spaniard (1.9%, a difference of 1.5%).
| Demographics | Rating | Rank | Doctorate Degree |
| Albanians | 74.8 /100 | #151 | Good 1.9% |
| Immigrants | Kenya | 74.3 /100 | #152 | Good 1.9% |
| Immigrants | Oceania | 74.0 /100 | #153 | Good 1.9% |
| Immigrants | Albania | 72.8 /100 | #154 | Good 1.9% |
| Poles | 72.7 /100 | #155 | Good 1.9% |
| Slavs | 72.4 /100 | #156 | Good 1.9% |
| Danes | 71.9 /100 | #157 | Good 1.9% |
| Hungarians | 71.7 /100 | #158 | Good 1.9% |
| Slovenes | 70.2 /100 | #159 | Good 1.9% |
| Welsh | 69.7 /100 | #160 | Good 1.9% |
| Immigrants | Middle Africa | 68.8 /100 | #161 | Good 1.9% |
| Irish | 67.5 /100 | #162 | Good 1.9% |
| Czechs | 67.3 /100 | #163 | Good 1.9% |
| Celtics | 66.7 /100 | #164 | Good 1.9% |
| Scotch-Irish | 63.6 /100 | #165 | Good 1.9% |
| Spaniards | 63.5 /100 | #166 | Good 1.9% |
| Macedonians | 60.9 /100 | #167 | Good 1.9% |
| Sri Lankans | 60.3 /100 | #168 | Good 1.9% |
| Vietnamese | 54.8 /100 | #169 | Average 1.9% |
| Costa Ricans | 53.3 /100 | #170 | Average 1.8% |
| Bermudans | 52.1 /100 | #171 | Average 1.8% |