Apache vs English Doctorate Degree
COMPARE
Apache
English
Doctorate Degree
Doctorate Degree Comparison
Apache
English
1.5%
DOCTORATE DEGREE
1.3/ 100
METRIC RATING
251st/ 347
METRIC RANK
1.9%
DOCTORATE DEGREE
75.9/ 100
METRIC RATING
150th/ 347
METRIC RANK
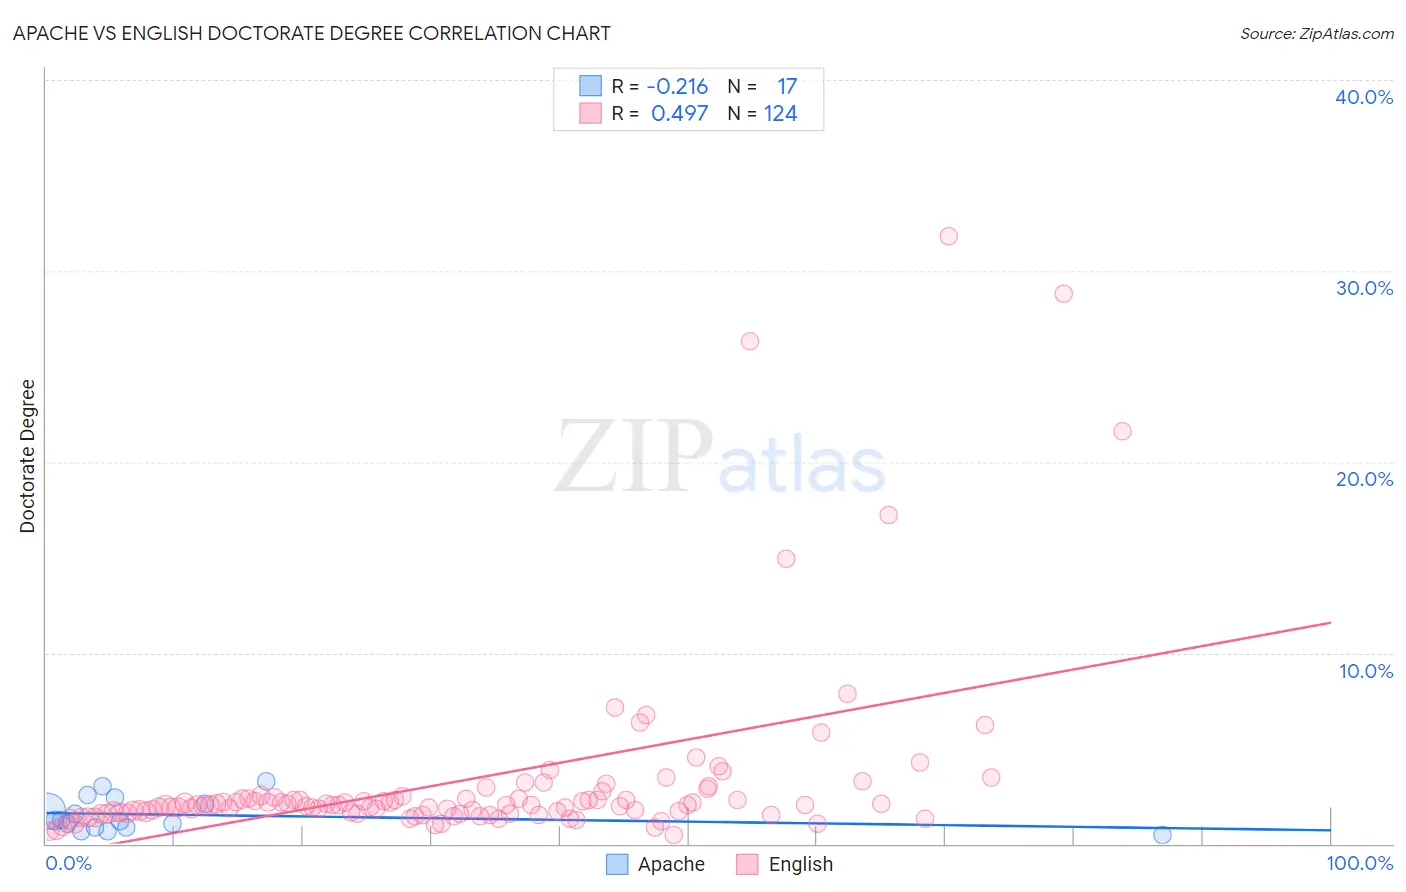
Apache vs English Doctorate Degree Correlation Chart
The statistical analysis conducted on geographies consisting of 228,067,045 people shows a weak negative correlation between the proportion of Apache and percentage of population with at least doctorate degree education in the United States with a correlation coefficient (R) of -0.216 and weighted average of 1.5%. Similarly, the statistical analysis conducted on geographies consisting of 550,351,908 people shows a moderate positive correlation between the proportion of English and percentage of population with at least doctorate degree education in the United States with a correlation coefficient (R) of 0.497 and weighted average of 1.9%, a difference of 23.8%.
Doctorate Degree Correlation Summary
| Measurement | Apache | English |
| Minimum | 0.48% | 0.49% |
| Maximum | 3.3% | 31.8% |
| Range | 2.8% | 31.3% |
| Mean | 1.5% | 3.3% |
| Median | 1.2% | 2.0% |
| Interquartile 25% (IQ1) | 0.86% | 1.6% |
| Interquartile 75% (IQ3) | 2.3% | 2.4% |
| Interquartile Range (IQR) | 1.4% | 0.77% |
| Standard Deviation (Sample) | 0.85% | 4.9% |
| Standard Deviation (Population) | 0.82% | 4.9% |
Similar Demographics by Doctorate Degree
Demographics Similar to Apache by Doctorate Degree
In terms of doctorate degree, the demographic groups most similar to Apache are Immigrants from Fiji (1.6%, a difference of 0.87%), Potawatomi (1.6%, a difference of 0.90%), Yuman (1.5%, a difference of 0.92%), American (1.5%, a difference of 1.1%), and Immigrants from Cambodia (1.5%, a difference of 1.2%).
| Demographics | Rating | Rank | Doctorate Degree |
| French American Indians | 2.0 /100 | #244 | Tragic 1.6% |
| Delaware | 1.9 /100 | #245 | Tragic 1.6% |
| Hmong | 1.8 /100 | #246 | Tragic 1.6% |
| Comanche | 1.8 /100 | #247 | Tragic 1.6% |
| Africans | 1.8 /100 | #248 | Tragic 1.6% |
| Potawatomi | 1.6 /100 | #249 | Tragic 1.6% |
| Immigrants | Fiji | 1.6 /100 | #250 | Tragic 1.6% |
| Apache | 1.3 /100 | #251 | Tragic 1.5% |
| Yuman | 1.1 /100 | #252 | Tragic 1.5% |
| Americans | 1.0 /100 | #253 | Tragic 1.5% |
| Immigrants | Cambodia | 1.0 /100 | #254 | Tragic 1.5% |
| Trinidadians and Tobagonians | 1.0 /100 | #255 | Tragic 1.5% |
| Central American Indians | 1.0 /100 | #256 | Tragic 1.5% |
| Chippewa | 0.9 /100 | #257 | Tragic 1.5% |
| Immigrants | West Indies | 0.9 /100 | #258 | Tragic 1.5% |
Demographics Similar to English by Doctorate Degree
In terms of doctorate degree, the demographic groups most similar to English are Albanian (1.9%, a difference of 0.19%), Basque (1.9%, a difference of 0.20%), Immigrants from Kenya (1.9%, a difference of 0.30%), Immigrants from Oceania (1.9%, a difference of 0.34%), and Immigrants from Albania (1.9%, a difference of 0.57%).
| Demographics | Rating | Rank | Doctorate Degree |
| Sierra Leoneans | 85.1 /100 | #143 | Excellent 2.0% |
| Immigrants | Moldova | 84.3 /100 | #144 | Excellent 2.0% |
| Kenyans | 83.6 /100 | #145 | Excellent 1.9% |
| Immigrants | Syria | 83.6 /100 | #146 | Excellent 1.9% |
| Immigrants | Senegal | 82.5 /100 | #147 | Excellent 1.9% |
| Luxembourgers | 81.1 /100 | #148 | Excellent 1.9% |
| Basques | 76.9 /100 | #149 | Good 1.9% |
| English | 75.9 /100 | #150 | Good 1.9% |
| Albanians | 74.8 /100 | #151 | Good 1.9% |
| Immigrants | Kenya | 74.3 /100 | #152 | Good 1.9% |
| Immigrants | Oceania | 74.0 /100 | #153 | Good 1.9% |
| Immigrants | Albania | 72.8 /100 | #154 | Good 1.9% |
| Poles | 72.7 /100 | #155 | Good 1.9% |
| Slavs | 72.4 /100 | #156 | Good 1.9% |
| Danes | 71.9 /100 | #157 | Good 1.9% |