Burmese vs Comanche Doctorate Degree
COMPARE
Burmese
Comanche
Doctorate Degree
Doctorate Degree Comparison
Burmese
Comanche
2.6%
DOCTORATE DEGREE
100.0/ 100
METRIC RATING
28th/ 347
METRIC RANK
1.6%
DOCTORATE DEGREE
1.8/ 100
METRIC RATING
247th/ 347
METRIC RANK
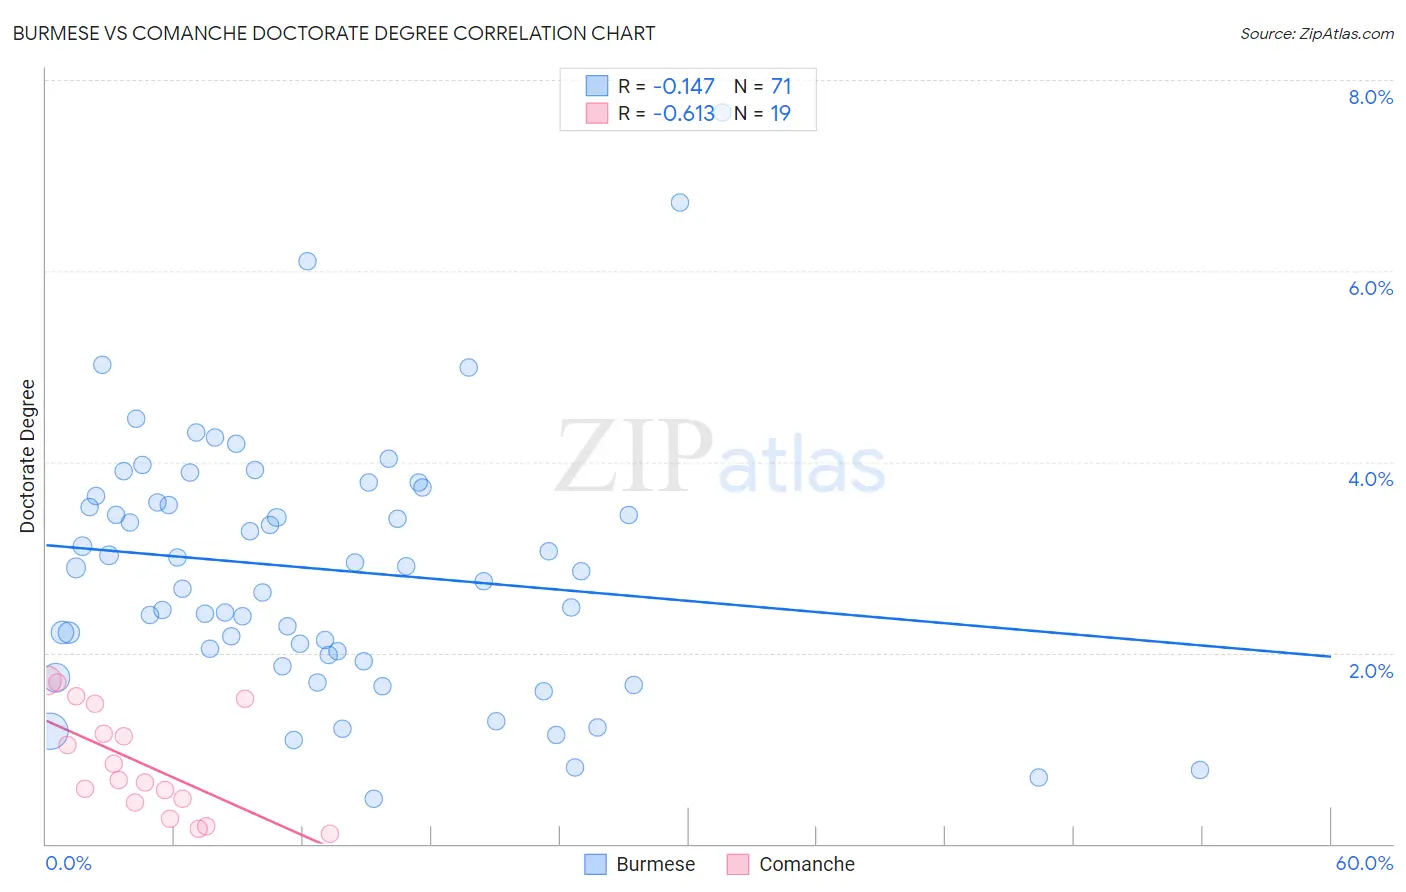
Burmese vs Comanche Doctorate Degree Correlation Chart
The statistical analysis conducted on geographies consisting of 459,661,532 people shows a poor negative correlation between the proportion of Burmese and percentage of population with at least doctorate degree education in the United States with a correlation coefficient (R) of -0.147 and weighted average of 2.6%. Similarly, the statistical analysis conducted on geographies consisting of 108,720,636 people shows a significant negative correlation between the proportion of Comanche and percentage of population with at least doctorate degree education in the United States with a correlation coefficient (R) of -0.613 and weighted average of 1.6%, a difference of 67.8%.
Doctorate Degree Correlation Summary
| Measurement | Burmese | Comanche |
| Minimum | 0.47% | 0.10% |
| Maximum | 7.7% | 1.7% |
| Range | 7.2% | 1.6% |
| Mean | 2.9% | 0.85% |
| Median | 2.9% | 0.67% |
| Interquartile 25% (IQ1) | 2.0% | 0.43% |
| Interquartile 75% (IQ3) | 3.6% | 1.5% |
| Interquartile Range (IQR) | 1.7% | 1.0% |
| Standard Deviation (Sample) | 1.4% | 0.54% |
| Standard Deviation (Population) | 1.3% | 0.53% |
Similar Demographics by Doctorate Degree
Demographics Similar to Burmese by Doctorate Degree
In terms of doctorate degree, the demographic groups most similar to Burmese are Immigrants from South Central Asia (2.6%, a difference of 0.26%), Immigrants from Turkey (2.6%, a difference of 0.30%), Immigrants from Korea (2.6%, a difference of 0.30%), Turkish (2.7%, a difference of 1.2%), and Immigrants from Saudi Arabia (2.7%, a difference of 1.7%).
| Demographics | Rating | Rank | Doctorate Degree |
| Thais | 100.0 /100 | #21 | Exceptional 2.8% |
| Mongolians | 100.0 /100 | #22 | Exceptional 2.8% |
| Immigrants | Denmark | 100.0 /100 | #23 | Exceptional 2.8% |
| Israelis | 100.0 /100 | #24 | Exceptional 2.7% |
| Immigrants | Saudi Arabia | 100.0 /100 | #25 | Exceptional 2.7% |
| Turks | 100.0 /100 | #26 | Exceptional 2.7% |
| Immigrants | Turkey | 100.0 /100 | #27 | Exceptional 2.6% |
| Burmese | 100.0 /100 | #28 | Exceptional 2.6% |
| Immigrants | South Central Asia | 100.0 /100 | #29 | Exceptional 2.6% |
| Immigrants | Korea | 100.0 /100 | #30 | Exceptional 2.6% |
| Latvians | 100.0 /100 | #31 | Exceptional 2.6% |
| Immigrants | Northern Europe | 100.0 /100 | #32 | Exceptional 2.6% |
| Cambodians | 100.0 /100 | #33 | Exceptional 2.6% |
| Cypriots | 100.0 /100 | #34 | Exceptional 2.6% |
| Immigrants | Malaysia | 100.0 /100 | #35 | Exceptional 2.6% |
Demographics Similar to Comanche by Doctorate Degree
In terms of doctorate degree, the demographic groups most similar to Comanche are Hmong (1.6%, a difference of 0.020%), Delaware (1.6%, a difference of 0.12%), African (1.6%, a difference of 0.12%), French American Indian (1.6%, a difference of 0.49%), and Potawatomi (1.6%, a difference of 0.59%).
| Demographics | Rating | Rank | Doctorate Degree |
| Immigrants | Panama | 2.4 /100 | #240 | Tragic 1.6% |
| Cheyenne | 2.3 /100 | #241 | Tragic 1.6% |
| Ottawa | 2.2 /100 | #242 | Tragic 1.6% |
| Native Hawaiians | 2.1 /100 | #243 | Tragic 1.6% |
| French American Indians | 2.0 /100 | #244 | Tragic 1.6% |
| Delaware | 1.9 /100 | #245 | Tragic 1.6% |
| Hmong | 1.8 /100 | #246 | Tragic 1.6% |
| Comanche | 1.8 /100 | #247 | Tragic 1.6% |
| Africans | 1.8 /100 | #248 | Tragic 1.6% |
| Potawatomi | 1.6 /100 | #249 | Tragic 1.6% |
| Immigrants | Fiji | 1.6 /100 | #250 | Tragic 1.6% |
| Apache | 1.3 /100 | #251 | Tragic 1.5% |
| Yuman | 1.1 /100 | #252 | Tragic 1.5% |
| Americans | 1.0 /100 | #253 | Tragic 1.5% |
| Immigrants | Cambodia | 1.0 /100 | #254 | Tragic 1.5% |