Spanish vs Comanche Doctorate Degree
COMPARE
Spanish
Comanche
Doctorate Degree
Doctorate Degree Comparison
Spanish
Comanche
1.8%
DOCTORATE DEGREE
49.3/ 100
METRIC RATING
176th/ 347
METRIC RANK
1.6%
DOCTORATE DEGREE
1.8/ 100
METRIC RATING
247th/ 347
METRIC RANK
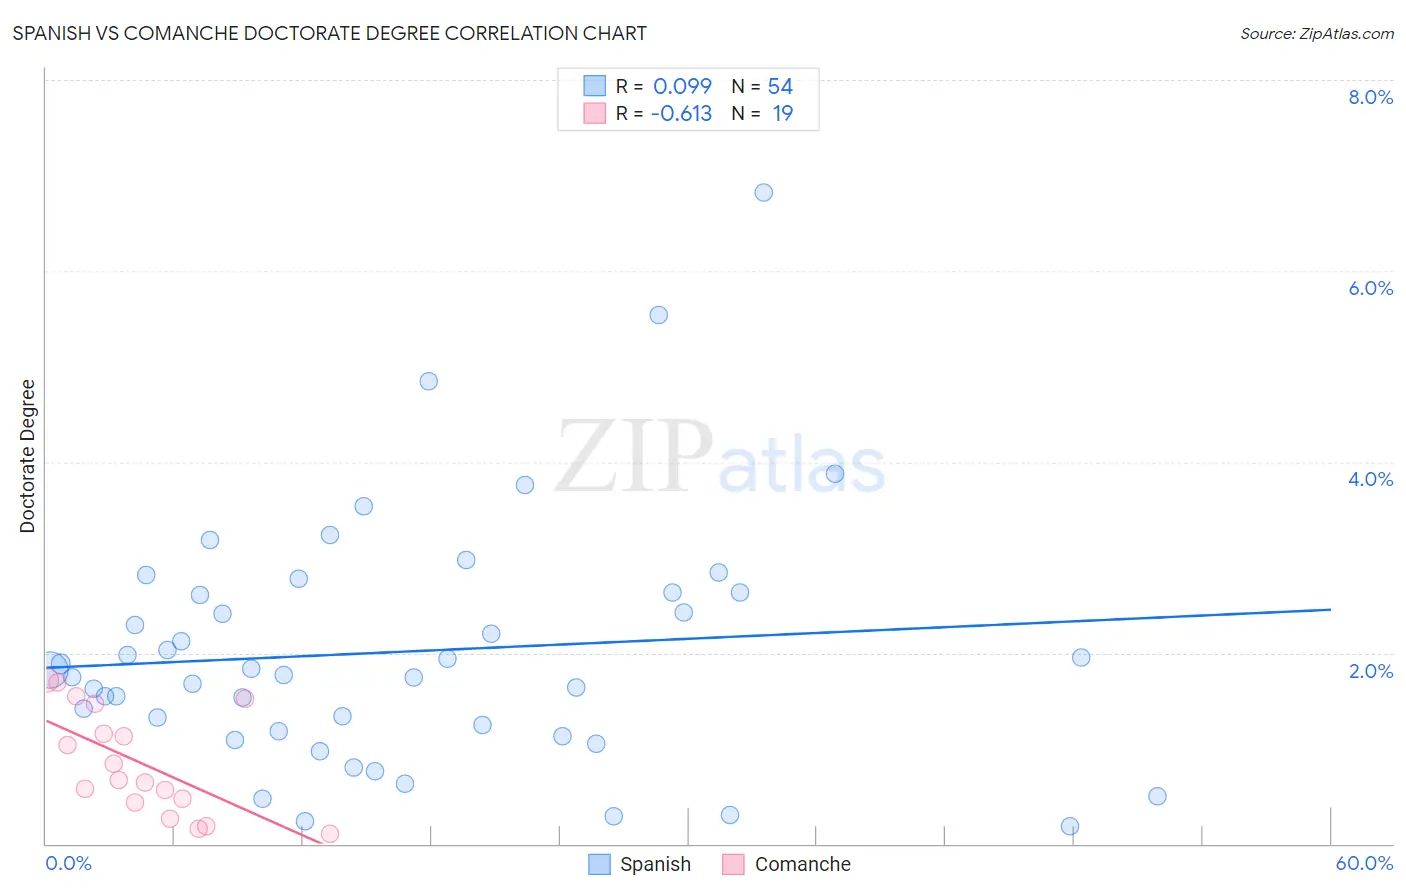
Spanish vs Comanche Doctorate Degree Correlation Chart
The statistical analysis conducted on geographies consisting of 416,138,041 people shows a slight positive correlation between the proportion of Spanish and percentage of population with at least doctorate degree education in the United States with a correlation coefficient (R) of 0.099 and weighted average of 1.8%. Similarly, the statistical analysis conducted on geographies consisting of 108,720,636 people shows a significant negative correlation between the proportion of Comanche and percentage of population with at least doctorate degree education in the United States with a correlation coefficient (R) of -0.613 and weighted average of 1.6%, a difference of 17.0%.
Doctorate Degree Correlation Summary
| Measurement | Spanish | Comanche |
| Minimum | 0.18% | 0.10% |
| Maximum | 6.8% | 1.7% |
| Range | 6.6% | 1.6% |
| Mean | 2.0% | 0.85% |
| Median | 1.8% | 0.67% |
| Interquartile 25% (IQ1) | 1.2% | 0.43% |
| Interquartile 75% (IQ3) | 2.6% | 1.5% |
| Interquartile Range (IQR) | 1.5% | 1.0% |
| Standard Deviation (Sample) | 1.3% | 0.54% |
| Standard Deviation (Population) | 1.3% | 0.53% |
Similar Demographics by Doctorate Degree
Demographics Similar to Spanish by Doctorate Degree
In terms of doctorate degree, the demographic groups most similar to Spanish are Iraqi (1.8%, a difference of 0.010%), Immigrants from Thailand (1.8%, a difference of 0.020%), French (1.8%, a difference of 0.070%), Norwegian (1.8%, a difference of 0.10%), and Immigrants from Bangladesh (1.8%, a difference of 0.10%).
| Demographics | Rating | Rank | Doctorate Degree |
| Vietnamese | 54.8 /100 | #169 | Average 1.9% |
| Costa Ricans | 53.3 /100 | #170 | Average 1.8% |
| Bermudans | 52.1 /100 | #171 | Average 1.8% |
| Belgians | 50.3 /100 | #172 | Average 1.8% |
| Norwegians | 50.0 /100 | #173 | Average 1.8% |
| Immigrants | Bangladesh | 50.0 /100 | #174 | Average 1.8% |
| Immigrants | Thailand | 49.4 /100 | #175 | Average 1.8% |
| Spanish | 49.3 /100 | #176 | Average 1.8% |
| Iraqis | 49.2 /100 | #177 | Average 1.8% |
| French | 48.8 /100 | #178 | Average 1.8% |
| Ghanaians | 48.3 /100 | #179 | Average 1.8% |
| Scandinavians | 48.0 /100 | #180 | Average 1.8% |
| Immigrants | Immigrants | 46.2 /100 | #181 | Average 1.8% |
| Immigrants | Afghanistan | 44.3 /100 | #182 | Average 1.8% |
| Finns | 42.1 /100 | #183 | Average 1.8% |
Demographics Similar to Comanche by Doctorate Degree
In terms of doctorate degree, the demographic groups most similar to Comanche are Hmong (1.6%, a difference of 0.020%), Delaware (1.6%, a difference of 0.12%), African (1.6%, a difference of 0.12%), French American Indian (1.6%, a difference of 0.49%), and Potawatomi (1.6%, a difference of 0.59%).
| Demographics | Rating | Rank | Doctorate Degree |
| Immigrants | Panama | 2.4 /100 | #240 | Tragic 1.6% |
| Cheyenne | 2.3 /100 | #241 | Tragic 1.6% |
| Ottawa | 2.2 /100 | #242 | Tragic 1.6% |
| Native Hawaiians | 2.1 /100 | #243 | Tragic 1.6% |
| French American Indians | 2.0 /100 | #244 | Tragic 1.6% |
| Delaware | 1.9 /100 | #245 | Tragic 1.6% |
| Hmong | 1.8 /100 | #246 | Tragic 1.6% |
| Comanche | 1.8 /100 | #247 | Tragic 1.6% |
| Africans | 1.8 /100 | #248 | Tragic 1.6% |
| Potawatomi | 1.6 /100 | #249 | Tragic 1.6% |
| Immigrants | Fiji | 1.6 /100 | #250 | Tragic 1.6% |
| Apache | 1.3 /100 | #251 | Tragic 1.5% |
| Yuman | 1.1 /100 | #252 | Tragic 1.5% |
| Americans | 1.0 /100 | #253 | Tragic 1.5% |
| Immigrants | Cambodia | 1.0 /100 | #254 | Tragic 1.5% |