American vs Immigrants from Singapore In Labor Force | Age 20-64
COMPARE
American
Immigrants from Singapore
In Labor Force | Age 20-64
In Labor Force | Age 20-64 Comparison
Americans
Immigrants from Singapore
77.0%
IN LABOR FORCE | AGE 20-64
0.0/ 100
METRIC RATING
309th/ 347
METRIC RANK
79.9%
IN LABOR FORCE | AGE 20-64
86.7/ 100
METRIC RATING
136th/ 347
METRIC RANK
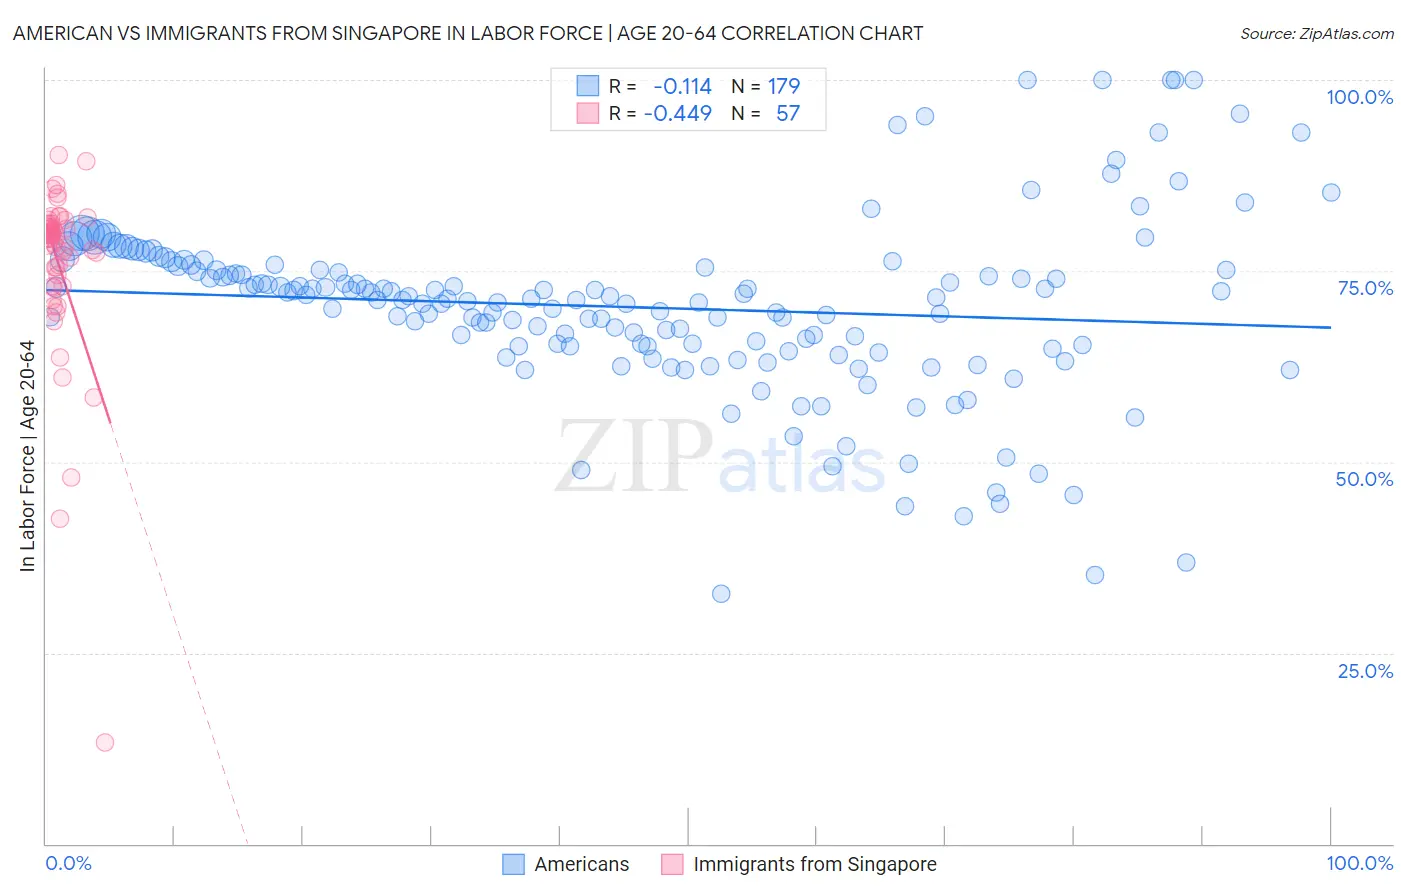
American vs Immigrants from Singapore In Labor Force | Age 20-64 Correlation Chart
The statistical analysis conducted on geographies consisting of 581,969,133 people shows a poor negative correlation between the proportion of Americans and labor force participation rate among population between the ages 20 and 64 in the United States with a correlation coefficient (R) of -0.114 and weighted average of 77.0%. Similarly, the statistical analysis conducted on geographies consisting of 137,521,700 people shows a moderate negative correlation between the proportion of Immigrants from Singapore and labor force participation rate among population between the ages 20 and 64 in the United States with a correlation coefficient (R) of -0.449 and weighted average of 79.9%, a difference of 3.7%.
In Labor Force | Age 20-64 Correlation Summary
| Measurement | American | Immigrants from Singapore |
| Minimum | 32.8% | 13.2% |
| Maximum | 100.0% | 90.1% |
| Range | 67.2% | 76.9% |
| Mean | 70.3% | 75.7% |
| Median | 71.3% | 79.7% |
| Interquartile 25% (IQ1) | 65.2% | 73.7% |
| Interquartile 75% (IQ3) | 75.2% | 81.0% |
| Interquartile Range (IQR) | 10.0% | 7.3% |
| Standard Deviation (Sample) | 11.6% | 12.0% |
| Standard Deviation (Population) | 11.5% | 11.9% |
Similar Demographics by In Labor Force | Age 20-64
Demographics Similar to Americans by In Labor Force | Age 20-64
In terms of in labor force | age 20-64, the demographic groups most similar to Americans are Alaska Native (77.0%, a difference of 0.010%), Comanche (77.0%, a difference of 0.020%), Blackfeet (77.0%, a difference of 0.050%), Central American Indian (77.1%, a difference of 0.060%), and Alaskan Athabascan (76.9%, a difference of 0.22%).
| Demographics | Rating | Rank | In Labor Force | Age 20-64 |
| Iroquois | 0.0 /100 | #302 | Tragic 77.5% |
| Chippewa | 0.0 /100 | #303 | Tragic 77.3% |
| Immigrants | Mexico | 0.0 /100 | #304 | Tragic 77.3% |
| Mexicans | 0.0 /100 | #305 | Tragic 77.2% |
| Potawatomi | 0.0 /100 | #306 | Tragic 77.2% |
| Central American Indians | 0.0 /100 | #307 | Tragic 77.1% |
| Alaska Natives | 0.0 /100 | #308 | Tragic 77.0% |
| Americans | 0.0 /100 | #309 | Tragic 77.0% |
| Comanche | 0.0 /100 | #310 | Tragic 77.0% |
| Blackfeet | 0.0 /100 | #311 | Tragic 77.0% |
| Alaskan Athabascans | 0.0 /100 | #312 | Tragic 76.9% |
| Shoshone | 0.0 /100 | #313 | Tragic 76.8% |
| Blacks/African Americans | 0.0 /100 | #314 | Tragic 76.8% |
| Ottawa | 0.0 /100 | #315 | Tragic 76.7% |
| Yaqui | 0.0 /100 | #316 | Tragic 76.5% |
Demographics Similar to Immigrants from Singapore by In Labor Force | Age 20-64
In terms of in labor force | age 20-64, the demographic groups most similar to Immigrants from Singapore are Ukrainian (79.9%, a difference of 0.0%), Immigrants from Ukraine (79.9%, a difference of 0.0%), Belgian (79.9%, a difference of 0.010%), Immigrants from Nigeria (79.9%, a difference of 0.010%), and Indian (Asian) (79.9%, a difference of 0.020%).
| Demographics | Rating | Rank | In Labor Force | Age 20-64 |
| Italians | 88.9 /100 | #129 | Excellent 79.9% |
| Immigrants | Zaire | 88.6 /100 | #130 | Excellent 79.9% |
| Immigrants | Iran | 88.3 /100 | #131 | Excellent 79.9% |
| Indians (Asian) | 87.7 /100 | #132 | Excellent 79.9% |
| South American Indians | 87.6 /100 | #133 | Excellent 79.9% |
| Belgians | 87.4 /100 | #134 | Excellent 79.9% |
| Ukrainians | 86.8 /100 | #135 | Excellent 79.9% |
| Immigrants | Singapore | 86.7 /100 | #136 | Excellent 79.9% |
| Immigrants | Ukraine | 86.5 /100 | #137 | Excellent 79.9% |
| Immigrants | Nigeria | 86.4 /100 | #138 | Excellent 79.9% |
| Immigrants | Spain | 83.9 /100 | #139 | Excellent 79.8% |
| Immigrants | South Eastern Asia | 80.4 /100 | #140 | Excellent 79.8% |
| Immigrants | Israel | 80.0 /100 | #141 | Good 79.8% |
| Slovaks | 79.9 /100 | #142 | Good 79.8% |
| Immigrants | Sweden | 79.7 /100 | #143 | Good 79.8% |