American vs Immigrants from Singapore Median Male Earnings
COMPARE
American
Immigrants from Singapore
Median Male Earnings
Median Male Earnings Comparison
Americans
Immigrants from Singapore
$50,761
MEDIAN MALE EARNINGS
2.5/ 100
METRIC RATING
239th/ 347
METRIC RANK
$71,348
MEDIAN MALE EARNINGS
100.0/ 100
METRIC RATING
5th/ 347
METRIC RANK
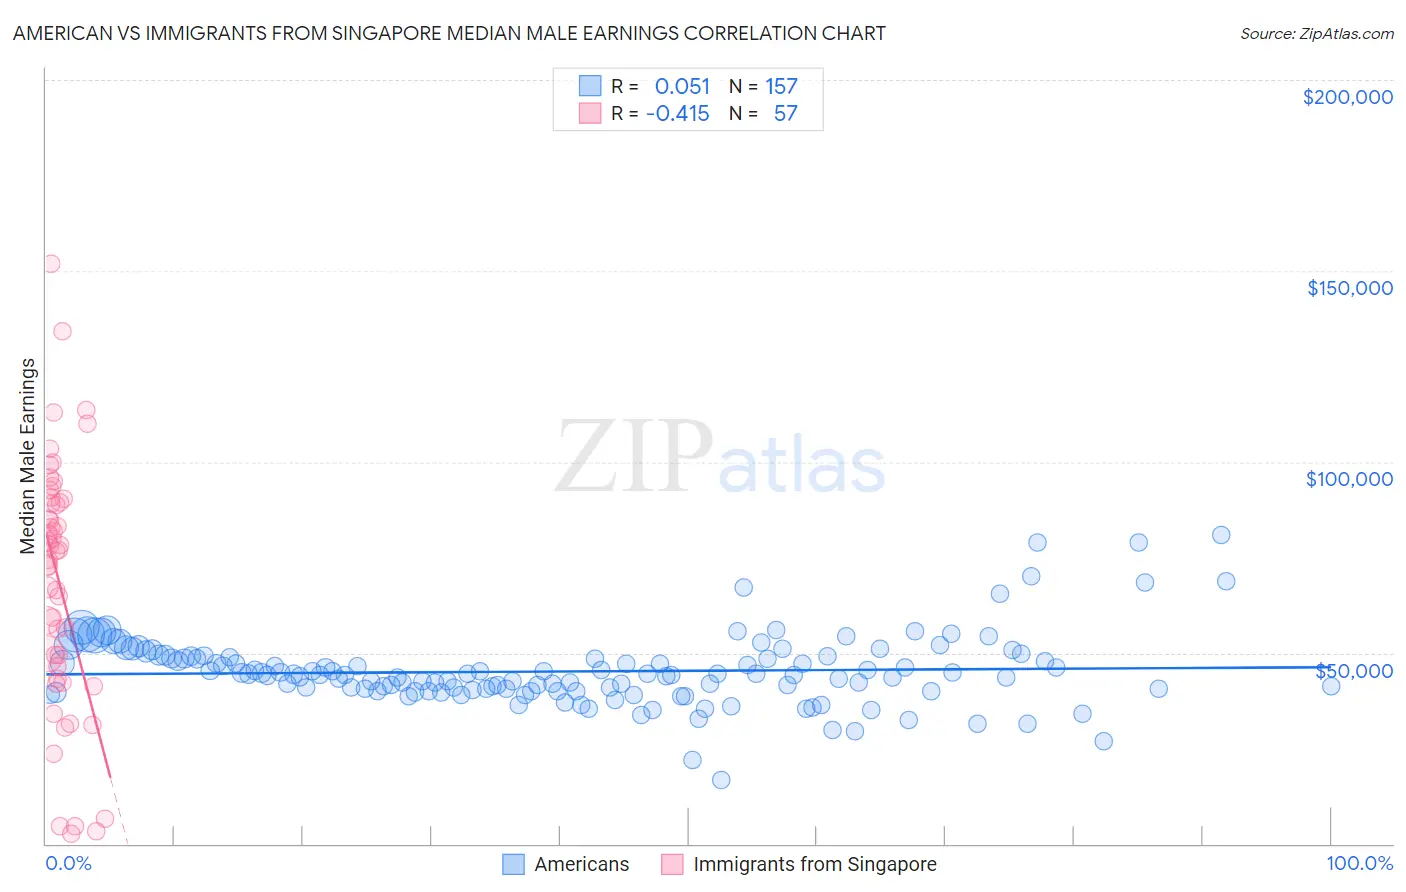
American vs Immigrants from Singapore Median Male Earnings Correlation Chart
The statistical analysis conducted on geographies consisting of 580,042,530 people shows a slight positive correlation between the proportion of Americans and median male earnings in the United States with a correlation coefficient (R) of 0.051 and weighted average of $50,761. Similarly, the statistical analysis conducted on geographies consisting of 137,517,070 people shows a moderate negative correlation between the proportion of Immigrants from Singapore and median male earnings in the United States with a correlation coefficient (R) of -0.415 and weighted average of $71,348, a difference of 40.6%.
Median Male Earnings Correlation Summary
| Measurement | American | Immigrants from Singapore |
| Minimum | $16,756 | $2,499 |
| Maximum | $80,855 | $151,839 |
| Range | $64,099 | $149,340 |
| Mean | $45,104 | $68,476 |
| Median | $44,329 | $76,629 |
| Interquartile 25% (IQ1) | $40,142 | $44,952 |
| Interquartile 75% (IQ3) | $48,927 | $89,757 |
| Interquartile Range (IQR) | $8,785 | $44,804 |
| Standard Deviation (Sample) | $9,213 | $32,686 |
| Standard Deviation (Population) | $9,183 | $32,398 |
Similar Demographics by Median Male Earnings
Demographics Similar to Americans by Median Male Earnings
In terms of median male earnings, the demographic groups most similar to Americans are Malaysian ($50,772, a difference of 0.020%), Immigrants from Barbados ($50,795, a difference of 0.070%), West Indian ($50,682, a difference of 0.16%), Immigrants from St. Vincent and the Grenadines ($50,665, a difference of 0.19%), and Pennsylvania German ($50,878, a difference of 0.23%).
| Demographics | Rating | Rank | Median Male Earnings |
| Sudanese | 3.9 /100 | #232 | Tragic $51,216 |
| Aleuts | 3.7 /100 | #233 | Tragic $51,168 |
| Cape Verdeans | 3.5 /100 | #234 | Tragic $51,103 |
| Immigrants | Western Africa | 3.0 /100 | #235 | Tragic $50,940 |
| Pennsylvania Germans | 2.8 /100 | #236 | Tragic $50,878 |
| Immigrants | Barbados | 2.6 /100 | #237 | Tragic $50,795 |
| Malaysians | 2.5 /100 | #238 | Tragic $50,772 |
| Americans | 2.5 /100 | #239 | Tragic $50,761 |
| West Indians | 2.3 /100 | #240 | Tragic $50,682 |
| Immigrants | St. Vincent and the Grenadines | 2.3 /100 | #241 | Tragic $50,665 |
| Guyanese | 2.2 /100 | #242 | Tragic $50,613 |
| French American Indians | 2.2 /100 | #243 | Tragic $50,611 |
| Houma | 2.0 /100 | #244 | Tragic $50,547 |
| Hawaiians | 1.9 /100 | #245 | Tragic $50,488 |
| Immigrants | Ecuador | 1.9 /100 | #246 | Tragic $50,474 |
Demographics Similar to Immigrants from Singapore by Median Male Earnings
In terms of median male earnings, the demographic groups most similar to Immigrants from Singapore are Iranian ($70,648, a difference of 0.99%), Thai ($72,135, a difference of 1.1%), Immigrants from Hong Kong ($70,146, a difference of 1.7%), Immigrants from Iran ($69,284, a difference of 3.0%), and Immigrants from South Central Asia ($68,960, a difference of 3.5%).
| Demographics | Rating | Rank | Median Male Earnings |
| Filipinos | 100.0 /100 | #1 | Exceptional $74,224 |
| Immigrants | India | 100.0 /100 | #2 | Exceptional $74,207 |
| Immigrants | Taiwan | 100.0 /100 | #3 | Exceptional $74,031 |
| Thais | 100.0 /100 | #4 | Exceptional $72,135 |
| Immigrants | Singapore | 100.0 /100 | #5 | Exceptional $71,348 |
| Iranians | 100.0 /100 | #6 | Exceptional $70,648 |
| Immigrants | Hong Kong | 100.0 /100 | #7 | Exceptional $70,146 |
| Immigrants | Iran | 100.0 /100 | #8 | Exceptional $69,284 |
| Immigrants | South Central Asia | 100.0 /100 | #9 | Exceptional $68,960 |
| Immigrants | Israel | 100.0 /100 | #10 | Exceptional $68,716 |
| Immigrants | Ireland | 100.0 /100 | #11 | Exceptional $67,698 |
| Immigrants | Australia | 100.0 /100 | #12 | Exceptional $67,634 |
| Immigrants | China | 100.0 /100 | #13 | Exceptional $67,353 |
| Okinawans | 100.0 /100 | #14 | Exceptional $67,232 |
| Immigrants | Eastern Asia | 100.0 /100 | #15 | Exceptional $66,903 |