Immigrants from Barbados vs Immigrants from Singapore High School Diploma
COMPARE
Immigrants from Barbados
Immigrants from Singapore
High School Diploma
High School Diploma Comparison
Immigrants from Barbados
Immigrants from Singapore
86.4%
HIGH SCHOOL DIPLOMA
0.0/ 100
METRIC RATING
283rd/ 347
METRIC RANK
91.7%
HIGH SCHOOL DIPLOMA
99.9/ 100
METRIC RATING
17th/ 347
METRIC RANK
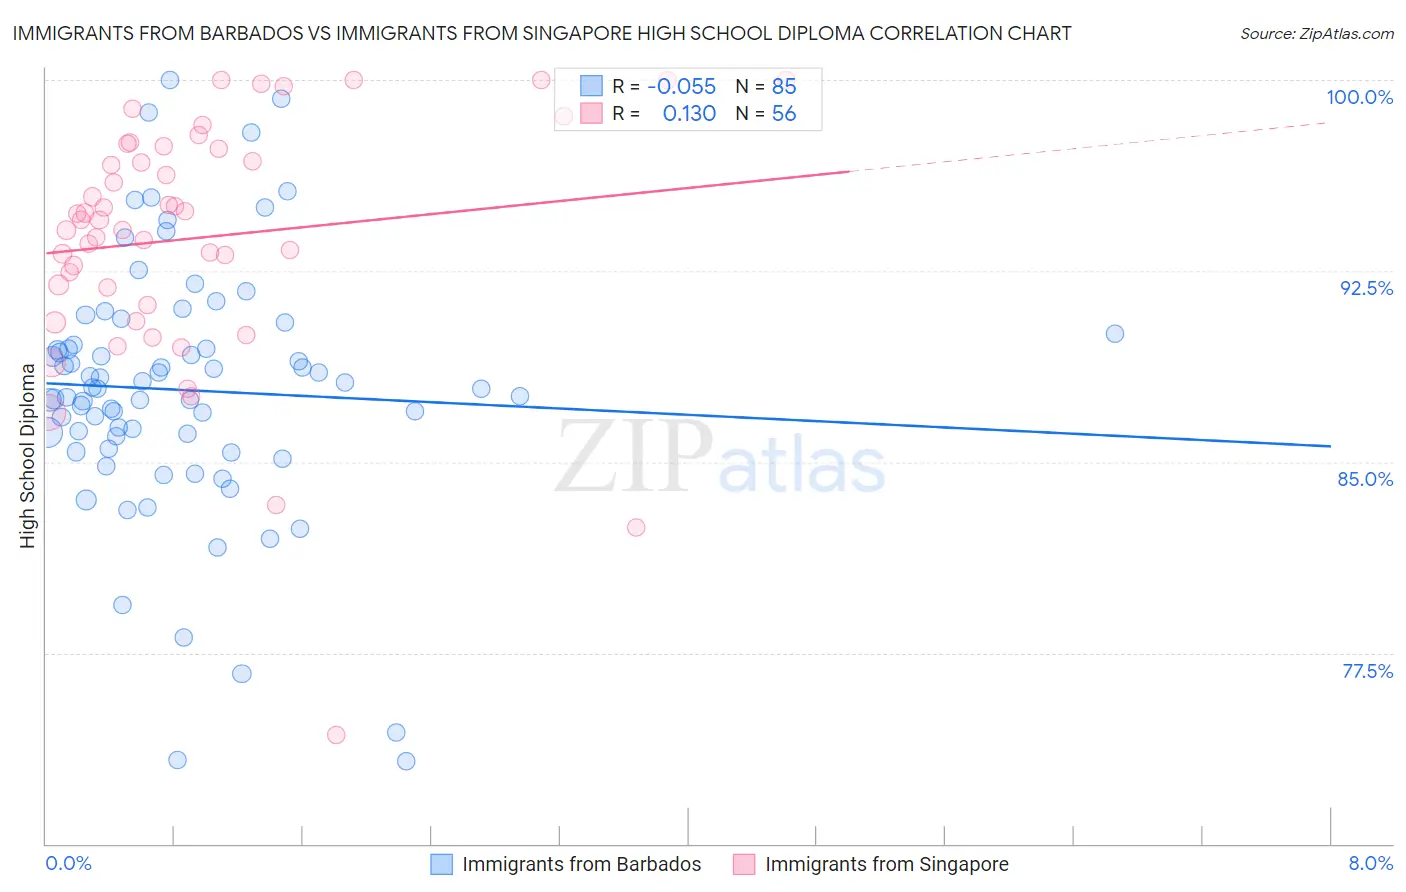
Immigrants from Barbados vs Immigrants from Singapore High School Diploma Correlation Chart
The statistical analysis conducted on geographies consisting of 112,782,130 people shows a slight negative correlation between the proportion of Immigrants from Barbados and percentage of population with at least high school diploma education in the United States with a correlation coefficient (R) of -0.055 and weighted average of 86.4%. Similarly, the statistical analysis conducted on geographies consisting of 137,521,094 people shows a poor positive correlation between the proportion of Immigrants from Singapore and percentage of population with at least high school diploma education in the United States with a correlation coefficient (R) of 0.130 and weighted average of 91.7%, a difference of 6.1%.
High School Diploma Correlation Summary
| Measurement | Immigrants from Barbados | Immigrants from Singapore |
| Minimum | 73.3% | 74.3% |
| Maximum | 100.0% | 100.0% |
| Range | 26.7% | 25.7% |
| Mean | 87.8% | 93.8% |
| Median | 87.9% | 94.5% |
| Interquartile 25% (IQ1) | 85.7% | 91.5% |
| Interquartile 75% (IQ3) | 89.8% | 97.3% |
| Interquartile Range (IQR) | 4.1% | 5.8% |
| Standard Deviation (Sample) | 5.1% | 4.9% |
| Standard Deviation (Population) | 5.0% | 4.9% |
Similar Demographics by High School Diploma
Demographics Similar to Immigrants from Barbados by High School Diploma
In terms of high school diploma, the demographic groups most similar to Immigrants from Barbados are Paiute (86.4%, a difference of 0.050%), Dutch West Indian (86.5%, a difference of 0.060%), Indonesian (86.5%, a difference of 0.10%), Pueblo (86.5%, a difference of 0.15%), and Immigrants from Laos (86.6%, a difference of 0.17%).
| Demographics | Rating | Rank | High School Diploma |
| Immigrants | Burma/Myanmar | 0.1 /100 | #276 | Tragic 86.7% |
| Barbadians | 0.1 /100 | #277 | Tragic 86.7% |
| Hopi | 0.1 /100 | #278 | Tragic 86.6% |
| Immigrants | Laos | 0.0 /100 | #279 | Tragic 86.6% |
| Pueblo | 0.0 /100 | #280 | Tragic 86.5% |
| Indonesians | 0.0 /100 | #281 | Tragic 86.5% |
| Dutch West Indians | 0.0 /100 | #282 | Tragic 86.5% |
| Immigrants | Barbados | 0.0 /100 | #283 | Tragic 86.4% |
| Paiute | 0.0 /100 | #284 | Tragic 86.4% |
| Immigrants | West Indies | 0.0 /100 | #285 | Tragic 86.2% |
| Immigrants | St. Vincent and the Grenadines | 0.0 /100 | #286 | Tragic 86.2% |
| Ute | 0.0 /100 | #287 | Tragic 86.2% |
| Immigrants | Vietnam | 0.0 /100 | #288 | Tragic 86.2% |
| Yup'ik | 0.0 /100 | #289 | Tragic 86.1% |
| Fijians | 0.0 /100 | #290 | Tragic 86.0% |
Demographics Similar to Immigrants from Singapore by High School Diploma
In terms of high school diploma, the demographic groups most similar to Immigrants from Singapore are German (91.7%, a difference of 0.010%), Finnish (91.7%, a difference of 0.040%), Luxembourger (91.7%, a difference of 0.060%), Maltese (91.6%, a difference of 0.080%), and Bulgarian (91.8%, a difference of 0.090%).
| Demographics | Rating | Rank | High School Diploma |
| Croatians | 100.0 /100 | #10 | Exceptional 92.0% |
| Eastern Europeans | 100.0 /100 | #11 | Exceptional 91.9% |
| Poles | 100.0 /100 | #12 | Exceptional 91.9% |
| Danes | 100.0 /100 | #13 | Exceptional 91.8% |
| Bulgarians | 100.0 /100 | #14 | Exceptional 91.8% |
| Luxembourgers | 100.0 /100 | #15 | Exceptional 91.7% |
| Finns | 100.0 /100 | #16 | Exceptional 91.7% |
| Immigrants | Singapore | 99.9 /100 | #17 | Exceptional 91.7% |
| Germans | 99.9 /100 | #18 | Exceptional 91.7% |
| Maltese | 99.9 /100 | #19 | Exceptional 91.6% |
| Czechs | 99.9 /100 | #20 | Exceptional 91.6% |
| Filipinos | 99.9 /100 | #21 | Exceptional 91.6% |
| Estonians | 99.9 /100 | #22 | Exceptional 91.6% |
| Scandinavians | 99.9 /100 | #23 | Exceptional 91.5% |
| Italians | 99.9 /100 | #24 | Exceptional 91.5% |