Irish vs Immigrants from India GED/Equivalency

COMPARE

Irish
Race
Ancestry
AfghanAfricanAlaska NativeAlaskan AthabascanAlbanianAleutAlsatianAmericanApacheArabArapahoArgentineanArmenianAssyrian/Chaldean/SyriacAustralianAustrianBahamianBangladeshiBarbadianBasqueBelgianBelizeanBermudanBhutaneseBlackfeetBolivianBrazilianBritishBritish West IndianBulgarianBurmeseCajunCambodianCanadianCape VerdeanCarpatho RusynCelticCentral AmericanCentral American IndianCherokeeCheyenneChickasawChileanChineseChippewaChoctawColombianColvilleComancheCosta RicanCreeCreekCroatianCrowCubanCypriotCzechCzechoslovakianDanishDelawareDominicanDutchDutch West IndianEastern EuropeanEcuadorianEgyptianEnglishEstonianEthiopianEuropeanFijianFilipinoFinnishFrenchFrench American IndianFrench CanadianGermanGerman RussianGhanaianGreekGuamanian/ChamorroGuatemalanGuyaneseHaitianHmongHonduranHopiHoumaHungarianIcelanderIndian (Asian)IndonesianInupiatIranianIraqiIrishIroquoisIsraeliItalianJamaicanJapaneseJordanianKenyanKiowaKoreanLaotianLatvianLebaneseLiberianLithuanianLumbeeLuxembourgerMacedonianMalaysianMalteseMarshalleseMenomineeMexicanMexican American IndianMongolianMoroccanNative HawaiianNavajoNepaleseNew ZealanderNicaraguanNigerianNorthern EuropeanNorwegianOkinawanOsageOttawaPaiutePakistaniPalestinianPanamanianParaguayanPennsylvania GermanPeruvianPimaPolishPortuguesePotawatomiPuebloPuerto RicanPuget Sound SalishRomanianRussianSalvadoranSamoanScandinavianScotch-IrishScottishSeminoleSenegaleseSerbianShoshoneSierra LeoneanSiouxSlavicSlovakSloveneSomaliSouth AfricanSouth AmericanSouth American IndianSoviet UnionSpaniardSpanishSpanish AmericanSpanish American IndianSri LankanSubsaharan AfricanSudaneseSwedishSwissSyrianTaiwaneseThaiTlingit-HaidaTohono O'OdhamTonganTrinidadian and TobagonianTsimshianTurkishU.S. Virgin IslanderUgandanUkrainianUruguayanUteVenezuelanVietnameseWelshWest IndianYakamaYaquiYugoslavianYumanYup'ikZimbabwean
Immigration
NonimmigrantsImmigrantsAfghanistanAfricaAlbaniaArgentinaArmeniaAsiaAustraliaAustriaBahamasBangladeshBarbadosBelarusBelgiumBelizeBoliviaBosnia and HerzegovinaBrazilBulgariaBurma/MyanmarCabo VerdeCambodiaCameroonCanadaCaribbeanCentral AmericaChileChinaColombiaCongoCosta RicaCroatiaCubaCzechoslovakiaDenmarkDominicaDominican RepublicEastern AfricaEastern AsiaEastern EuropeEcuadorEgyptEl SalvadorEnglandEritreaEthiopiaEuropeFijiFranceGermanyGhanaGreeceGrenadaGuatemalaGuyanaHaitiHondurasHong KongHungaryIndonesiaIranIraqIrelandIsraelItalyJamaicaJapanJordanKazakhstanKenyaKoreaKuwaitLaosLatin AmericaLatviaLebanonLiberiaLithuaniaMalaysiaMexicoMicronesiaMiddle AfricaMoldovaMoroccoNepalNetherlandsNicaraguaNigeriaNorth AmericaNorth MacedoniaNorthern AfricaNorthern EuropeNorwayOceaniaPakistanPanamaPeruPhilippinesPolandPortugalRomaniaRussiaSaudi ArabiaScotlandSenegalSerbiaSierra LeoneSingaporeSomaliaSouth AfricaSouth AmericaSouth Central AsiaSouth Eastern AsiaSouthern EuropeSpainSri LankaSt. Vincent and the GrenadinesSudanSwedenSwitzerlandSyriaTaiwanThailandTrinidad and TobagoTurkeyUgandaUkraineUruguayUzbekistanVenezuelaVietnamWest IndiesWestern AfricaWestern AsiaWestern EuropeYemenZaireZimbabweAzores
Immigrants from India
Race
Ancestry
AfghanAfricanAlaska NativeAlaskan AthabascanAlbanianAleutAlsatianAmericanApacheArabArapahoArgentineanArmenianAssyrian/Chaldean/SyriacAustralianAustrianBahamianBangladeshiBarbadianBasqueBelgianBelizeanBermudanBhutaneseBlackfeetBolivianBrazilianBritishBritish West IndianBulgarianBurmeseCajunCambodianCanadianCape VerdeanCarpatho RusynCelticCentral AmericanCentral American IndianCherokeeCheyenneChickasawChileanChineseChippewaChoctawColombianColvilleComancheCosta RicanCreeCreekCroatianCrowCubanCypriotCzechCzechoslovakianDanishDelawareDominicanDutchDutch West IndianEastern EuropeanEcuadorianEgyptianEnglishEstonianEthiopianEuropeanFijianFilipinoFinnishFrenchFrench American IndianFrench CanadianGermanGerman RussianGhanaianGreekGuamanian/ChamorroGuatemalanGuyaneseHaitianHmongHonduranHopiHoumaHungarianIcelanderIndian (Asian)IndonesianInupiatIranianIraqiIroquoisIsraeliItalianJamaicanJapaneseJordanianKenyanKiowaKoreanLaotianLatvianLebaneseLiberianLithuanianLumbeeLuxembourgerMacedonianMalaysianMalteseMarshalleseMenomineeMexicanMexican American IndianMongolianMoroccanNative HawaiianNavajoNepaleseNew ZealanderNicaraguanNigerianNorthern EuropeanNorwegianOkinawanOsageOttawaPaiutePakistaniPalestinianPanamanianParaguayanPennsylvania GermanPeruvianPimaPolishPortuguesePotawatomiPuebloPuerto RicanPuget Sound SalishRomanianRussianSalvadoranSamoanScandinavianScotch-IrishScottishSeminoleSenegaleseSerbianShoshoneSierra LeoneanSiouxSlavicSlovakSloveneSomaliSouth AfricanSouth AmericanSouth American IndianSoviet UnionSpaniardSpanishSpanish AmericanSpanish American IndianSri LankanSubsaharan AfricanSudaneseSwedishSwissSyrianTaiwaneseThaiTlingit-HaidaTohono O'OdhamTonganTrinidadian and TobagonianTsimshianTurkishU.S. Virgin IslanderUgandanUkrainianUruguayanUteVenezuelanVietnameseWelshWest IndianYakamaYaquiYugoslavianYumanYup'ikZimbabwean
Immigration
NonimmigrantsImmigrantsAfghanistanAfricaAlbaniaArgentinaArmeniaAsiaAustraliaAustriaBahamasBangladeshBarbadosBelarusBelgiumBelizeBoliviaBosnia and HerzegovinaBrazilBulgariaBurma/MyanmarCabo VerdeCambodiaCameroonCanadaCaribbeanCentral AmericaChileChinaColombiaCongoCosta RicaCroatiaCubaCzechoslovakiaDenmarkDominicaDominican RepublicEastern AfricaEastern AsiaEastern EuropeEcuadorEgyptEl SalvadorEnglandEritreaEthiopiaEuropeFijiFranceGermanyGhanaGreeceGrenadaGuatemalaGuyanaHaitiHondurasHong KongHungaryIndiaIndonesiaIranIraqIrelandIsraelItalyJamaicaJapanJordanKazakhstanKenyaKoreaKuwaitLaosLatin AmericaLatviaLebanonLiberiaLithuaniaMalaysiaMexicoMicronesiaMiddle AfricaMoldovaMoroccoNepalNetherlandsNicaraguaNigeriaNorth AmericaNorth MacedoniaNorthern AfricaNorthern EuropeNorwayOceaniaPakistanPanamaPeruPhilippinesPolandPortugalRomaniaRussiaSaudi ArabiaScotlandSenegalSerbiaSierra LeoneSingaporeSomaliaSouth AfricaSouth AmericaSouth Central AsiaSouth Eastern AsiaSouthern EuropeSpainSri LankaSt. Vincent and the GrenadinesSudanSwedenSwitzerlandSyriaTaiwanThailandTrinidad and TobagoTurkeyUgandaUkraineUruguayUzbekistanVenezuelaVietnamWest IndiesWestern AfricaWestern AsiaWestern EuropeYemenZaireZimbabweAzores
GED/Equivalency
Income
Poverty
Unemployment
Labor Participation
Family Structure
Vehicle Availability
Education Level
Disability

GED/Equivalency Comparison

Irish

Immigrants from India

Exceptional
Exceptional
87.6%
GED/EQUIVALENCY
98.6/ 100
METRIC RATING
78th/ 347
METRIC RANK
89.7%
GED/EQUIVALENCY
100.0/ 100
METRIC RATING
1st/ 347
METRIC RANK

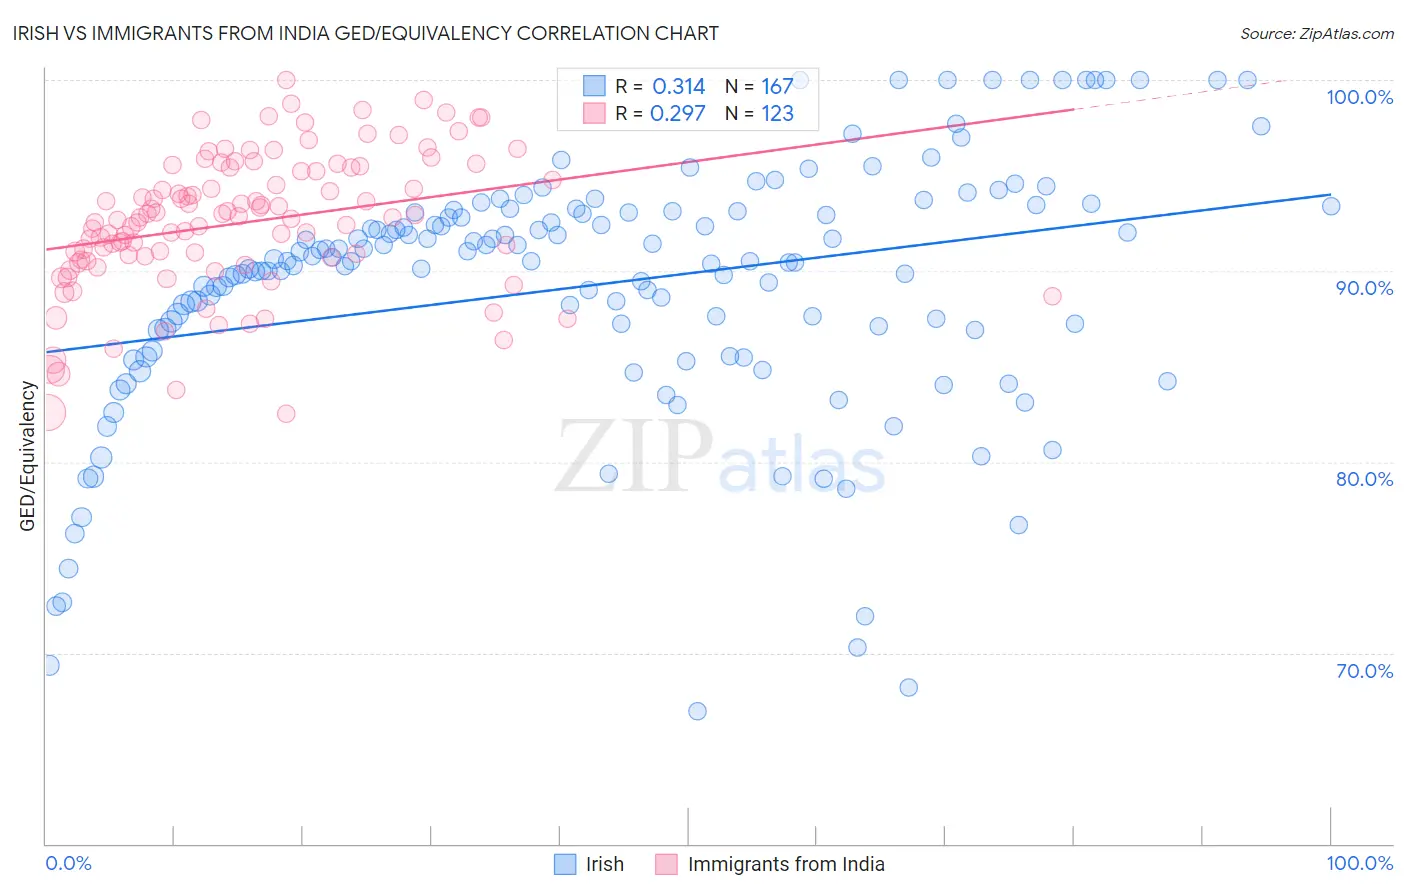
Irish vs Immigrants from India GED/Equivalency Correlation Chart

The statistical analysis conducted on geographies consisting of 580,709,357 people shows a mild positive correlation between the proportion of Irish and percentage of population with at least ged/equivalency education in the United States with a correlation coefficient (R) of 0.314 and weighted average of 87.6%. Similarly, the statistical analysis conducted on geographies consisting of 434,105,844 people shows a weak positive correlation between the proportion of Immigrants from India and percentage of population with at least ged/equivalency education in the United States with a correlation coefficient (R) of 0.297 and weighted average of 89.7%, a difference of 2.4%.
Irish vs Immigrants from India GED/Equivalency

GED/Equivalency Correlation Summary

MeasurementIrishImmigrants from India
Minimum67.0%82.6%
Maximum100.0%100.0%
Range33.0%17.4%
Mean89.2%92.5%
Median90.5%92.8%
Interquartile 25% (IQ1)86.9%90.6%
Interquartile 75% (IQ3)93.1%95.4%
Interquartile Range (IQR)6.2%4.8%
Standard Deviation (Sample)6.6%3.6%
Standard Deviation (Population)6.6%3.6%

Similar Demographics by GED/Equivalency

Demographics Similar to Irish by GED/Equivalency

In terms of ged/equivalency, the demographic groups most similar to Irish are Slavic (87.7%, a difference of 0.020%), Immigrants from Serbia (87.7%, a difference of 0.030%), English (87.6%, a difference of 0.030%), Scottish (87.7%, a difference of 0.040%), and Immigrants from Kuwait (87.7%, a difference of 0.060%).
DemographicsRating | RankGED/Equivalency
Austrians
98.8
/100
|
#71
Exceptional
87.7%
Immigrants | Moldova
98.8
/100
|
#72
Exceptional
87.7%
Belgians
98.8
/100
|
#73
Exceptional
87.7%
Immigrants | Kuwait
98.8
/100
|
#74
Exceptional
87.7%
Scottish
98.7
/100
|
#75
Exceptional
87.7%
Immigrants | Serbia
98.7
/100
|
#76
Exceptional
87.7%
Slavs
98.7
/100
|
#77
Exceptional
87.7%
Irish
98.6
/100
|
#78
Exceptional
87.6%
English
98.6
/100
|
#79
Exceptional
87.6%
Immigrants | England
98.5
/100
|
#80
Exceptional
87.6%
Immigrants | Sri Lanka
98.3
/100
|
#81
Exceptional
87.5%
Romanians
98.3
/100
|
#82
Exceptional
87.5%
South Africans
98.3
/100
|
#83
Exceptional
87.5%
Immigrants | Romania
98.1
/100
|
#84
Exceptional
87.5%
Dutch
98.1
/100
|
#85
Exceptional
87.5%

Demographics Similar to Immigrants from India by GED/Equivalency

In terms of ged/equivalency, the demographic groups most similar to Immigrants from India are Filipino (89.5%, a difference of 0.26%), Immigrants from Singapore (89.3%, a difference of 0.47%), Iranian (89.2%, a difference of 0.56%), Latvian (89.2%, a difference of 0.66%), and Thai (89.1%, a difference of 0.68%).
DemographicsRating | RankGED/Equivalency
Immigrants | India
100.0
/100
|
#1
Exceptional
89.7%
Filipinos
100.0
/100
|
#2
Exceptional
89.5%
Immigrants | Singapore
100.0
/100
|
#3
Exceptional
89.3%
Iranians
100.0
/100
|
#4
Exceptional
89.2%
Latvians
100.0
/100
|
#5
Exceptional
89.2%
Thais
100.0
/100
|
#6
Exceptional
89.1%
Eastern Europeans
99.9
/100
|
#7
Exceptional
89.1%
Carpatho Rusyns
99.9
/100
|
#8
Exceptional
89.1%
Chinese
99.9
/100
|
#9
Exceptional
89.0%
Norwegians
99.9
/100
|
#10
Exceptional
89.0%
Bulgarians
99.9
/100
|
#11
Exceptional
89.0%
Lithuanians
99.9
/100
|
#12
Exceptional
88.9%
Immigrants | Iran
99.9
/100
|
#13
Exceptional
88.9%
Cypriots
99.9
/100
|
#14
Exceptional
88.9%
Okinawans
99.9
/100
|
#15
Exceptional
88.9%