Immigrants from Netherlands vs Immigrants from India GED/Equivalency
COMPARE
Immigrants from Netherlands
Immigrants from India
GED/Equivalency
GED/Equivalency Comparison
Immigrants from Netherlands
Immigrants from India
88.0%
GED/EQUIVALENCY
99.4/ 100
METRIC RATING
51st/ 347
METRIC RANK
89.7%
GED/EQUIVALENCY
100.0/ 100
METRIC RATING
1st/ 347
METRIC RANK
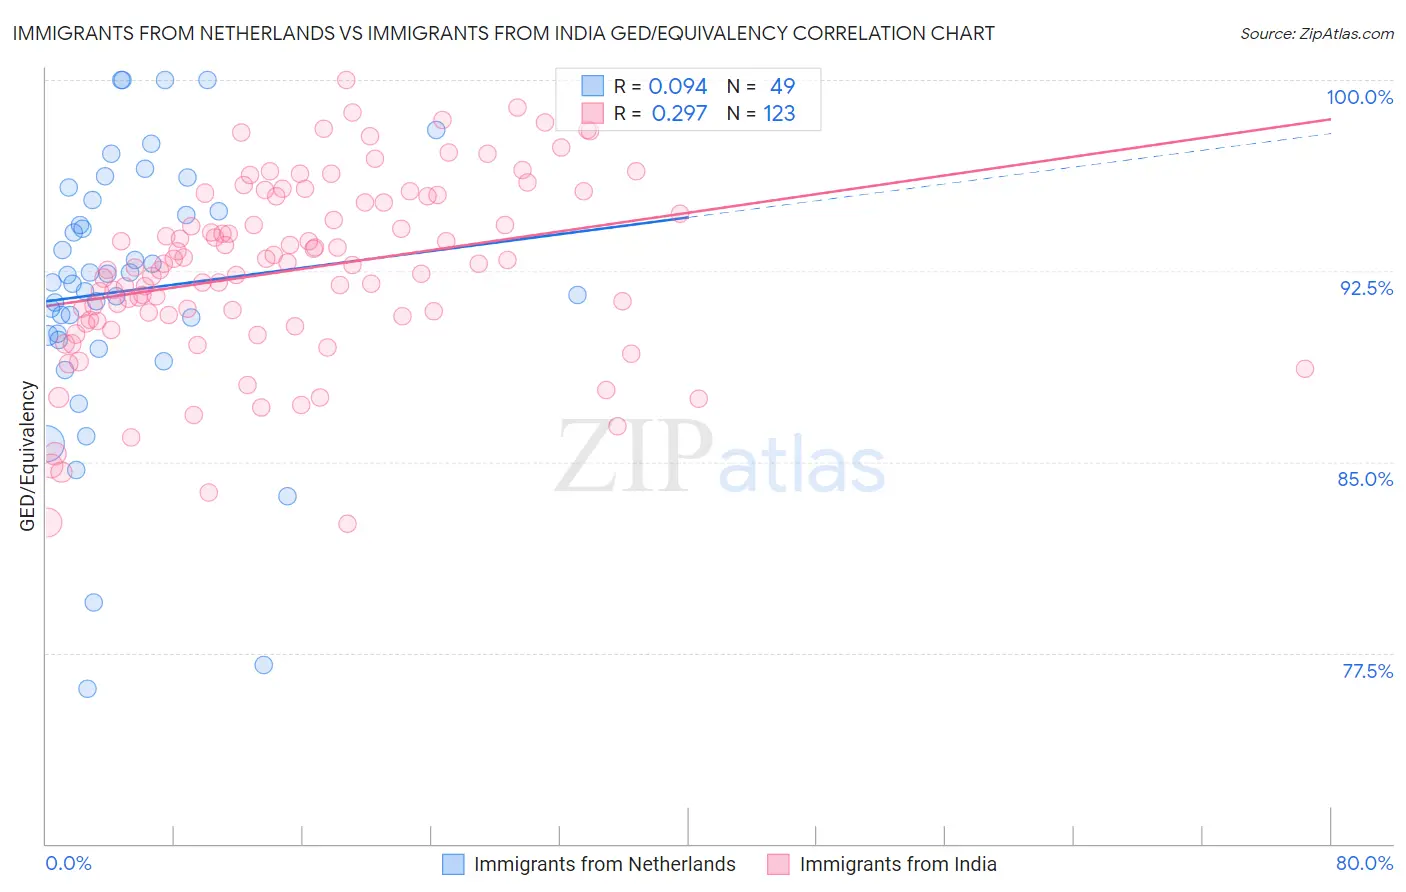
Immigrants from Netherlands vs Immigrants from India GED/Equivalency Correlation Chart
The statistical analysis conducted on geographies consisting of 237,874,463 people shows a slight positive correlation between the proportion of Immigrants from Netherlands and percentage of population with at least ged/equivalency education in the United States with a correlation coefficient (R) of 0.094 and weighted average of 88.0%. Similarly, the statistical analysis conducted on geographies consisting of 434,105,844 people shows a weak positive correlation between the proportion of Immigrants from India and percentage of population with at least ged/equivalency education in the United States with a correlation coefficient (R) of 0.297 and weighted average of 89.7%, a difference of 2.0%.
GED/Equivalency Correlation Summary
| Measurement | Immigrants from Netherlands | Immigrants from India |
| Minimum | 76.1% | 82.6% |
| Maximum | 100.0% | 100.0% |
| Range | 23.9% | 17.4% |
| Mean | 91.7% | 92.5% |
| Median | 92.1% | 92.8% |
| Interquartile 25% (IQ1) | 89.9% | 90.6% |
| Interquartile 75% (IQ3) | 95.1% | 95.4% |
| Interquartile Range (IQR) | 5.2% | 4.8% |
| Standard Deviation (Sample) | 5.3% | 3.6% |
| Standard Deviation (Population) | 5.3% | 3.6% |
Similar Demographics by GED/Equivalency
Demographics Similar to Immigrants from Netherlands by GED/Equivalency
In terms of ged/equivalency, the demographic groups most similar to Immigrants from Netherlands are Zimbabwean (88.0%, a difference of 0.0%), Immigrants from South Africa (88.0%, a difference of 0.0%), Soviet Union (88.0%, a difference of 0.010%), New Zealander (88.0%, a difference of 0.020%), and Immigrants from Denmark (88.0%, a difference of 0.030%).
| Demographics | Rating | Rank | GED/Equivalency |
| Macedonians | 99.5 /100 | #44 | Exceptional 88.1% |
| Czechs | 99.5 /100 | #45 | Exceptional 88.1% |
| Immigrants | Switzerland | 99.5 /100 | #46 | Exceptional 88.1% |
| Immigrants | Latvia | 99.5 /100 | #47 | Exceptional 88.1% |
| Greeks | 99.5 /100 | #48 | Exceptional 88.1% |
| Australians | 99.5 /100 | #49 | Exceptional 88.1% |
| Immigrants | Korea | 99.5 /100 | #50 | Exceptional 88.1% |
| Immigrants | Netherlands | 99.4 /100 | #51 | Exceptional 88.0% |
| Zimbabweans | 99.4 /100 | #52 | Exceptional 88.0% |
| Immigrants | South Africa | 99.4 /100 | #53 | Exceptional 88.0% |
| Soviet Union | 99.4 /100 | #54 | Exceptional 88.0% |
| New Zealanders | 99.4 /100 | #55 | Exceptional 88.0% |
| Immigrants | Denmark | 99.4 /100 | #56 | Exceptional 88.0% |
| Immigrants | Czechoslovakia | 99.3 /100 | #57 | Exceptional 87.9% |
| Northern Europeans | 99.3 /100 | #58 | Exceptional 87.9% |
Demographics Similar to Immigrants from India by GED/Equivalency
In terms of ged/equivalency, the demographic groups most similar to Immigrants from India are Filipino (89.5%, a difference of 0.26%), Immigrants from Singapore (89.3%, a difference of 0.47%), Iranian (89.2%, a difference of 0.56%), Latvian (89.2%, a difference of 0.66%), and Thai (89.1%, a difference of 0.68%).
| Demographics | Rating | Rank | GED/Equivalency |
| Immigrants | India | 100.0 /100 | #1 | Exceptional 89.7% |
| Filipinos | 100.0 /100 | #2 | Exceptional 89.5% |
| Immigrants | Singapore | 100.0 /100 | #3 | Exceptional 89.3% |
| Iranians | 100.0 /100 | #4 | Exceptional 89.2% |
| Latvians | 100.0 /100 | #5 | Exceptional 89.2% |
| Thais | 100.0 /100 | #6 | Exceptional 89.1% |
| Eastern Europeans | 99.9 /100 | #7 | Exceptional 89.1% |
| Carpatho Rusyns | 99.9 /100 | #8 | Exceptional 89.1% |
| Chinese | 99.9 /100 | #9 | Exceptional 89.0% |
| Norwegians | 99.9 /100 | #10 | Exceptional 89.0% |
| Bulgarians | 99.9 /100 | #11 | Exceptional 89.0% |
| Lithuanians | 99.9 /100 | #12 | Exceptional 88.9% |
| Immigrants | Iran | 99.9 /100 | #13 | Exceptional 88.9% |
| Cypriots | 99.9 /100 | #14 | Exceptional 88.9% |
| Okinawans | 99.9 /100 | #15 | Exceptional 88.9% |