Sudanese vs Immigrants from India GED/Equivalency
COMPARE
Sudanese
Immigrants from India
GED/Equivalency
GED/Equivalency Comparison
Sudanese
Immigrants from India
85.5%
GED/EQUIVALENCY
35.2/ 100
METRIC RATING
182nd/ 347
METRIC RANK
89.7%
GED/EQUIVALENCY
100.0/ 100
METRIC RATING
1st/ 347
METRIC RANK
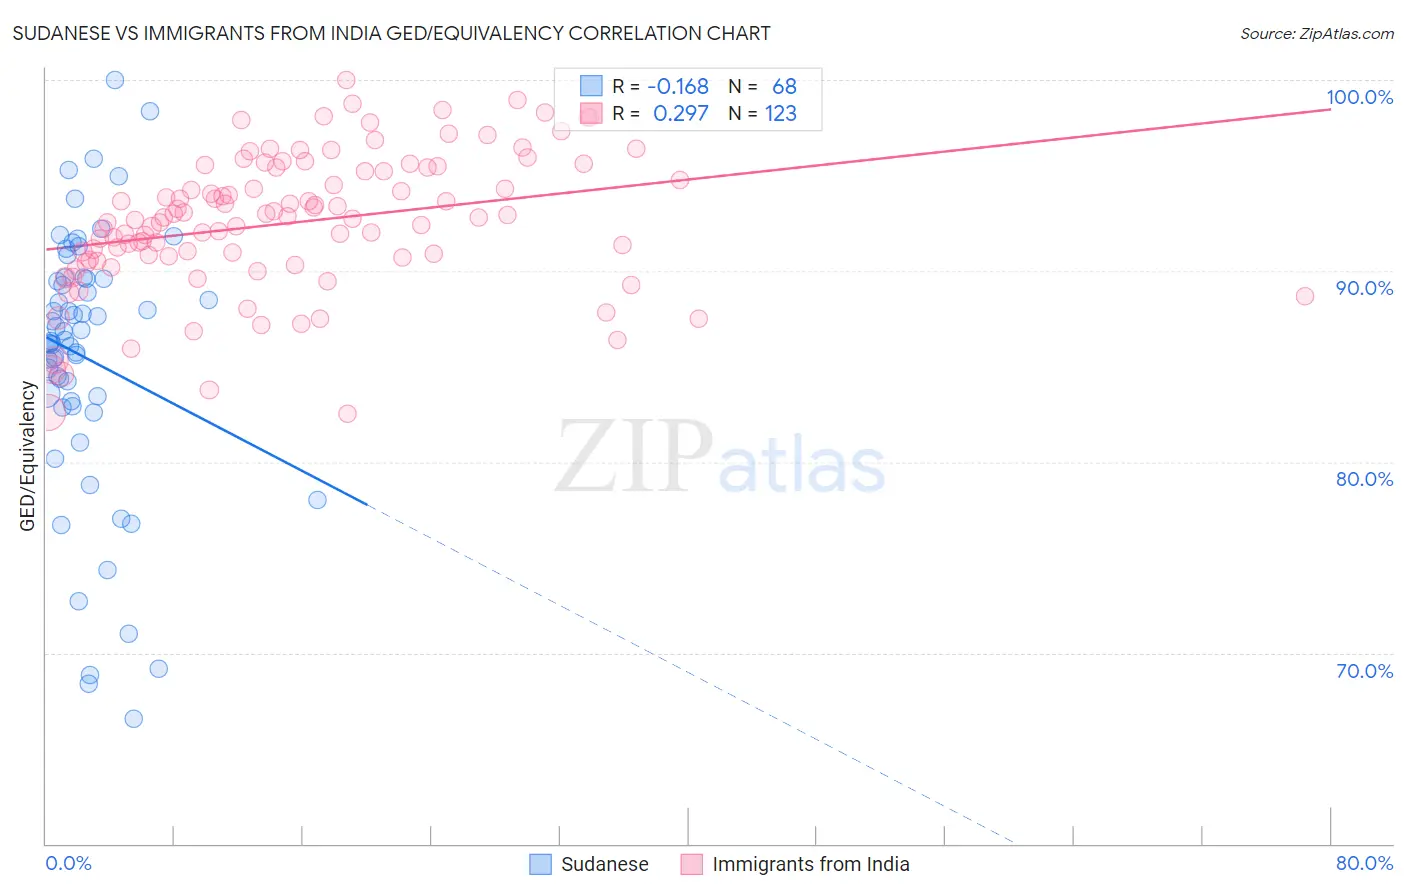
Sudanese vs Immigrants from India GED/Equivalency Correlation Chart
The statistical analysis conducted on geographies consisting of 110,147,806 people shows a poor negative correlation between the proportion of Sudanese and percentage of population with at least ged/equivalency education in the United States with a correlation coefficient (R) of -0.168 and weighted average of 85.5%. Similarly, the statistical analysis conducted on geographies consisting of 434,105,844 people shows a weak positive correlation between the proportion of Immigrants from India and percentage of population with at least ged/equivalency education in the United States with a correlation coefficient (R) of 0.297 and weighted average of 89.7%, a difference of 5.0%.
GED/Equivalency Correlation Summary
| Measurement | Sudanese | Immigrants from India |
| Minimum | 66.5% | 82.6% |
| Maximum | 100.0% | 100.0% |
| Range | 33.5% | 17.4% |
| Mean | 85.4% | 92.5% |
| Median | 86.4% | 92.8% |
| Interquartile 25% (IQ1) | 83.0% | 90.6% |
| Interquartile 75% (IQ3) | 89.6% | 95.4% |
| Interquartile Range (IQR) | 6.5% | 4.8% |
| Standard Deviation (Sample) | 7.0% | 3.6% |
| Standard Deviation (Population) | 7.0% | 3.6% |
Similar Demographics by GED/Equivalency
Demographics Similar to Sudanese by GED/Equivalency
In terms of ged/equivalency, the demographic groups most similar to Sudanese are Immigrants from Sudan (85.5%, a difference of 0.020%), Immigrants from Oceania (85.5%, a difference of 0.040%), Spanish (85.4%, a difference of 0.050%), Moroccan (85.5%, a difference of 0.060%), and Immigrants from Southern Europe (85.5%, a difference of 0.070%).
| Demographics | Rating | Rank | GED/Equivalency |
| Immigrants | Bolivia | 49.8 /100 | #175 | Average 85.8% |
| Immigrants | Eastern Africa | 47.7 /100 | #176 | Average 85.7% |
| Immigrants | Uganda | 45.2 /100 | #177 | Average 85.7% |
| Koreans | 41.2 /100 | #178 | Average 85.6% |
| Aleuts | 40.5 /100 | #179 | Average 85.6% |
| Immigrants | Southern Europe | 38.4 /100 | #180 | Fair 85.5% |
| Moroccans | 37.7 /100 | #181 | Fair 85.5% |
| Sudanese | 35.2 /100 | #182 | Fair 85.5% |
| Immigrants | Sudan | 34.2 /100 | #183 | Fair 85.5% |
| Immigrants | Oceania | 33.6 /100 | #184 | Fair 85.5% |
| Spanish | 32.8 /100 | #185 | Fair 85.4% |
| Spaniards | 31.9 /100 | #186 | Fair 85.4% |
| Immigrants | Afghanistan | 29.8 /100 | #187 | Fair 85.4% |
| Immigrants | Sierra Leone | 29.0 /100 | #188 | Fair 85.4% |
| Guamanians/Chamorros | 28.4 /100 | #189 | Fair 85.3% |
Demographics Similar to Immigrants from India by GED/Equivalency
In terms of ged/equivalency, the demographic groups most similar to Immigrants from India are Filipino (89.5%, a difference of 0.26%), Immigrants from Singapore (89.3%, a difference of 0.47%), Iranian (89.2%, a difference of 0.56%), Latvian (89.2%, a difference of 0.66%), and Thai (89.1%, a difference of 0.68%).
| Demographics | Rating | Rank | GED/Equivalency |
| Immigrants | India | 100.0 /100 | #1 | Exceptional 89.7% |
| Filipinos | 100.0 /100 | #2 | Exceptional 89.5% |
| Immigrants | Singapore | 100.0 /100 | #3 | Exceptional 89.3% |
| Iranians | 100.0 /100 | #4 | Exceptional 89.2% |
| Latvians | 100.0 /100 | #5 | Exceptional 89.2% |
| Thais | 100.0 /100 | #6 | Exceptional 89.1% |
| Eastern Europeans | 99.9 /100 | #7 | Exceptional 89.1% |
| Carpatho Rusyns | 99.9 /100 | #8 | Exceptional 89.1% |
| Chinese | 99.9 /100 | #9 | Exceptional 89.0% |
| Norwegians | 99.9 /100 | #10 | Exceptional 89.0% |
| Bulgarians | 99.9 /100 | #11 | Exceptional 89.0% |
| Lithuanians | 99.9 /100 | #12 | Exceptional 88.9% |
| Immigrants | Iran | 99.9 /100 | #13 | Exceptional 88.9% |
| Cypriots | 99.9 /100 | #14 | Exceptional 88.9% |
| Okinawans | 99.9 /100 | #15 | Exceptional 88.9% |