Aleut vs Immigrants from Uruguay GED/Equivalency
COMPARE
Aleut
Immigrants from Uruguay
GED/Equivalency
GED/Equivalency Comparison
Aleuts
Immigrants from Uruguay
85.6%
GED/EQUIVALENCY
40.5/ 100
METRIC RATING
179th/ 347
METRIC RANK
84.4%
GED/EQUIVALENCY
4.6/ 100
METRIC RATING
229th/ 347
METRIC RANK
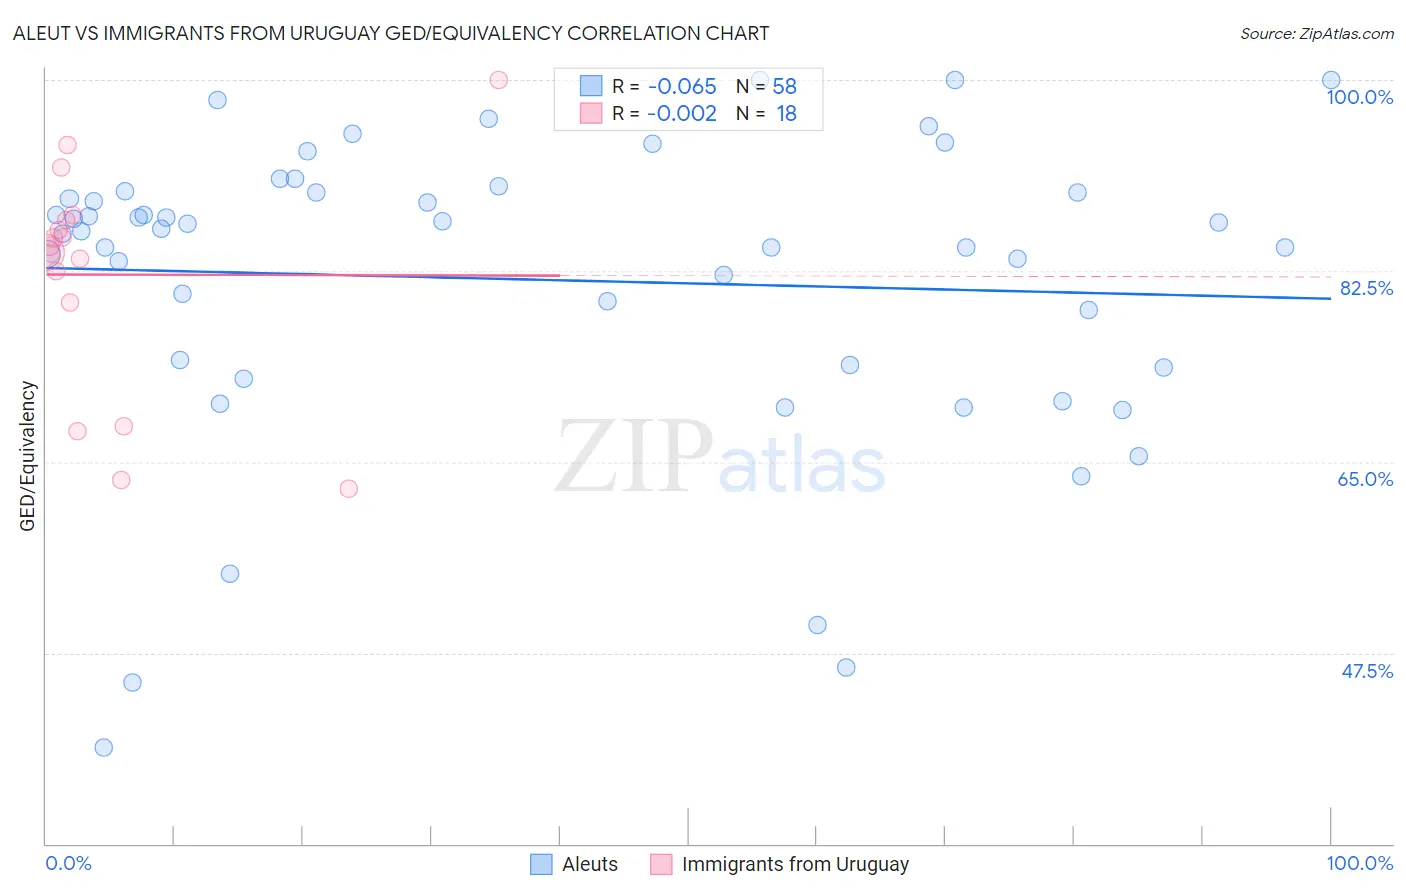
Aleut vs Immigrants from Uruguay GED/Equivalency Correlation Chart
The statistical analysis conducted on geographies consisting of 61,782,940 people shows a slight negative correlation between the proportion of Aleuts and percentage of population with at least ged/equivalency education in the United States with a correlation coefficient (R) of -0.065 and weighted average of 85.6%. Similarly, the statistical analysis conducted on geographies consisting of 133,259,667 people shows no correlation between the proportion of Immigrants from Uruguay and percentage of population with at least ged/equivalency education in the United States with a correlation coefficient (R) of -0.002 and weighted average of 84.4%, a difference of 1.4%.
GED/Equivalency Correlation Summary
| Measurement | Aleut | Immigrants from Uruguay |
| Minimum | 38.8% | 62.5% |
| Maximum | 100.0% | 100.0% |
| Range | 61.2% | 37.5% |
| Mean | 81.7% | 82.2% |
| Median | 86.3% | 84.4% |
| Interquartile 25% (IQ1) | 73.9% | 79.7% |
| Interquartile 75% (IQ3) | 89.7% | 87.2% |
| Interquartile Range (IQR) | 15.8% | 7.6% |
| Standard Deviation (Sample) | 13.9% | 10.3% |
| Standard Deviation (Population) | 13.8% | 10.0% |
Similar Demographics by GED/Equivalency
Demographics Similar to Aleuts by GED/Equivalency
In terms of ged/equivalency, the demographic groups most similar to Aleuts are Korean (85.6%, a difference of 0.020%), Immigrants from Southern Europe (85.5%, a difference of 0.040%), Moroccan (85.5%, a difference of 0.060%), Immigrants from Uganda (85.7%, a difference of 0.10%), and Sudanese (85.5%, a difference of 0.12%).
| Demographics | Rating | Rank | GED/Equivalency |
| Bermudans | 55.1 /100 | #172 | Average 85.8% |
| Immigrants | Venezuela | 50.7 /100 | #173 | Average 85.8% |
| Ottawa | 50.0 /100 | #174 | Average 85.8% |
| Immigrants | Bolivia | 49.8 /100 | #175 | Average 85.8% |
| Immigrants | Eastern Africa | 47.7 /100 | #176 | Average 85.7% |
| Immigrants | Uganda | 45.2 /100 | #177 | Average 85.7% |
| Koreans | 41.2 /100 | #178 | Average 85.6% |
| Aleuts | 40.5 /100 | #179 | Average 85.6% |
| Immigrants | Southern Europe | 38.4 /100 | #180 | Fair 85.5% |
| Moroccans | 37.7 /100 | #181 | Fair 85.5% |
| Sudanese | 35.2 /100 | #182 | Fair 85.5% |
| Immigrants | Sudan | 34.2 /100 | #183 | Fair 85.5% |
| Immigrants | Oceania | 33.6 /100 | #184 | Fair 85.5% |
| Spanish | 32.8 /100 | #185 | Fair 85.4% |
| Spaniards | 31.9 /100 | #186 | Fair 85.4% |
Demographics Similar to Immigrants from Uruguay by GED/Equivalency
In terms of ged/equivalency, the demographic groups most similar to Immigrants from Uruguay are Immigrants from Colombia (84.4%, a difference of 0.010%), Immigrants from Liberia (84.4%, a difference of 0.030%), Immigrants from Middle Africa (84.4%, a difference of 0.030%), Immigrants from South America (84.4%, a difference of 0.050%), and Immigrants from Panama (84.4%, a difference of 0.060%).
| Demographics | Rating | Rank | GED/Equivalency |
| Iroquois | 7.5 /100 | #222 | Tragic 84.6% |
| Immigrants | Uzbekistan | 7.1 /100 | #223 | Tragic 84.6% |
| French American Indians | 6.3 /100 | #224 | Tragic 84.6% |
| Immigrants | Thailand | 5.8 /100 | #225 | Tragic 84.5% |
| Immigrants | Zaire | 5.5 /100 | #226 | Tragic 84.5% |
| Immigrants | Costa Rica | 5.4 /100 | #227 | Tragic 84.5% |
| Immigrants | Liberia | 4.9 /100 | #228 | Tragic 84.4% |
| Immigrants | Uruguay | 4.6 /100 | #229 | Tragic 84.4% |
| Immigrants | Colombia | 4.5 /100 | #230 | Tragic 84.4% |
| Immigrants | Middle Africa | 4.3 /100 | #231 | Tragic 84.4% |
| Immigrants | South America | 4.2 /100 | #232 | Tragic 84.4% |
| Immigrants | Panama | 4.1 /100 | #233 | Tragic 84.4% |
| Immigrants | Nigeria | 3.6 /100 | #234 | Tragic 84.3% |
| Ghanaians | 3.5 /100 | #235 | Tragic 84.3% |
| Immigrants | Eritrea | 3.5 /100 | #236 | Tragic 84.3% |