Immigrants from Cabo Verde vs Immigrants from Uruguay GED/Equivalency
COMPARE
Immigrants from Cabo Verde
Immigrants from Uruguay
GED/Equivalency
GED/Equivalency Comparison
Immigrants from Cabo Verde
Immigrants from Uruguay
78.9%
GED/EQUIVALENCY
0.0/ 100
METRIC RATING
330th/ 347
METRIC RANK
84.4%
GED/EQUIVALENCY
4.6/ 100
METRIC RATING
229th/ 347
METRIC RANK
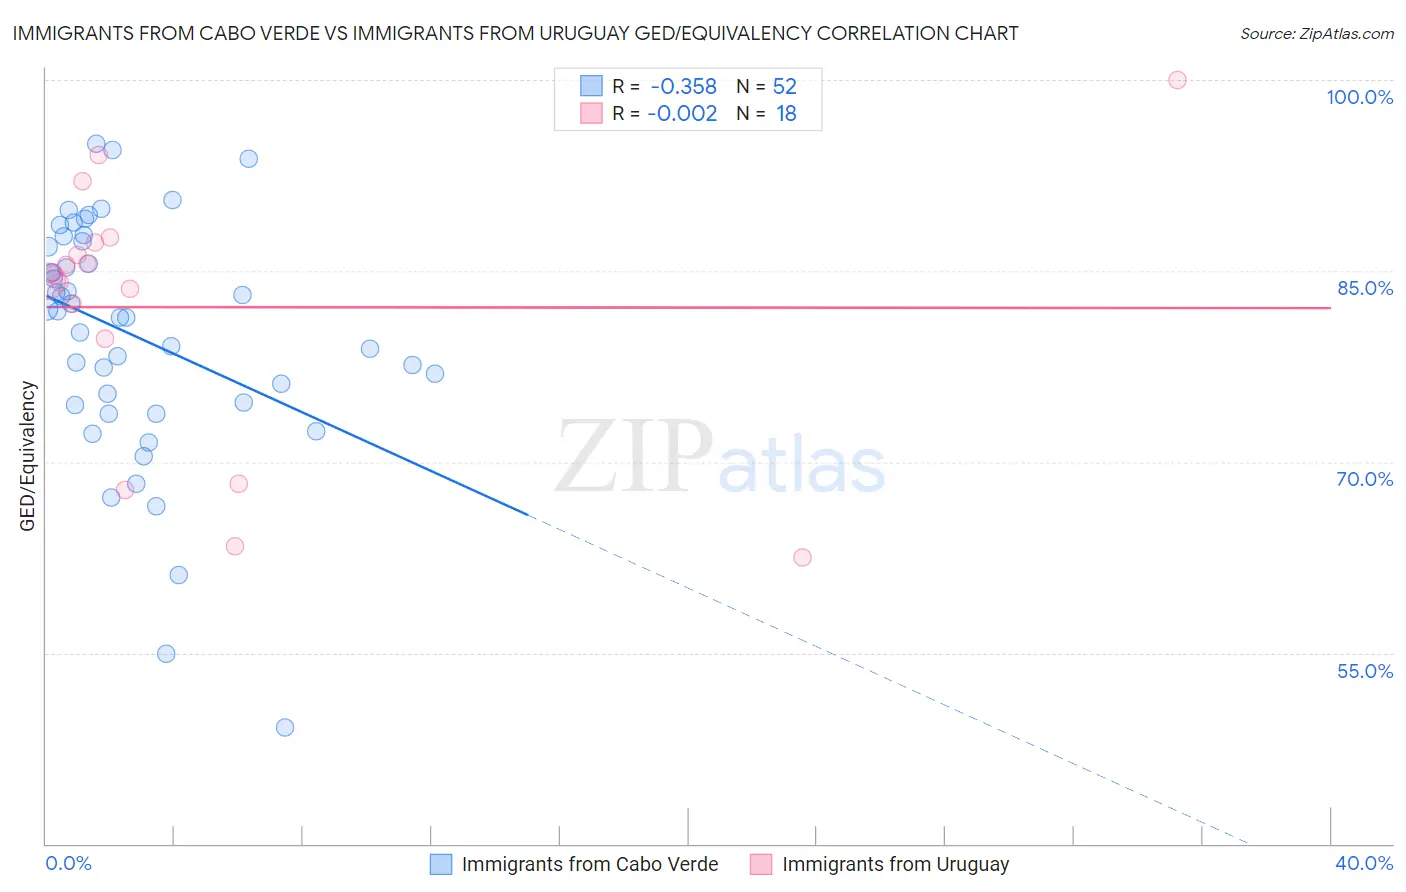
Immigrants from Cabo Verde vs Immigrants from Uruguay GED/Equivalency Correlation Chart
The statistical analysis conducted on geographies consisting of 38,158,504 people shows a mild negative correlation between the proportion of Immigrants from Cabo Verde and percentage of population with at least ged/equivalency education in the United States with a correlation coefficient (R) of -0.358 and weighted average of 78.9%. Similarly, the statistical analysis conducted on geographies consisting of 133,259,667 people shows no correlation between the proportion of Immigrants from Uruguay and percentage of population with at least ged/equivalency education in the United States with a correlation coefficient (R) of -0.002 and weighted average of 84.4%, a difference of 7.0%.
GED/Equivalency Correlation Summary
| Measurement | Immigrants from Cabo Verde | Immigrants from Uruguay |
| Minimum | 49.2% | 62.5% |
| Maximum | 95.0% | 100.0% |
| Range | 45.8% | 37.5% |
| Mean | 79.9% | 82.2% |
| Median | 81.6% | 84.4% |
| Interquartile 25% (IQ1) | 74.6% | 79.7% |
| Interquartile 75% (IQ3) | 87.1% | 87.2% |
| Interquartile Range (IQR) | 12.6% | 7.6% |
| Standard Deviation (Sample) | 9.5% | 10.3% |
| Standard Deviation (Population) | 9.4% | 10.0% |
Similar Demographics by GED/Equivalency
Demographics Similar to Immigrants from Cabo Verde by GED/Equivalency
In terms of ged/equivalency, the demographic groups most similar to Immigrants from Cabo Verde are Dominican (79.1%, a difference of 0.16%), Hispanic or Latino (79.1%, a difference of 0.20%), Immigrants from Honduras (78.7%, a difference of 0.24%), Central American (79.2%, a difference of 0.31%), and Yuman (79.2%, a difference of 0.33%).
| Demographics | Rating | Rank | GED/Equivalency |
| Immigrants | Nicaragua | 0.0 /100 | #323 | Tragic 79.9% |
| Mexican American Indians | 0.0 /100 | #324 | Tragic 79.4% |
| Hondurans | 0.0 /100 | #325 | Tragic 79.3% |
| Yuman | 0.0 /100 | #326 | Tragic 79.2% |
| Central Americans | 0.0 /100 | #327 | Tragic 79.2% |
| Hispanics or Latinos | 0.0 /100 | #328 | Tragic 79.1% |
| Dominicans | 0.0 /100 | #329 | Tragic 79.1% |
| Immigrants | Cabo Verde | 0.0 /100 | #330 | Tragic 78.9% |
| Immigrants | Honduras | 0.0 /100 | #331 | Tragic 78.7% |
| Immigrants | Azores | 0.0 /100 | #332 | Tragic 78.7% |
| Salvadorans | 0.0 /100 | #333 | Tragic 78.6% |
| Guatemalans | 0.0 /100 | #334 | Tragic 78.5% |
| Immigrants | Latin America | 0.0 /100 | #335 | Tragic 78.5% |
| Immigrants | Dominican Republic | 0.0 /100 | #336 | Tragic 78.0% |
| Immigrants | Yemen | 0.0 /100 | #337 | Tragic 77.9% |
Demographics Similar to Immigrants from Uruguay by GED/Equivalency
In terms of ged/equivalency, the demographic groups most similar to Immigrants from Uruguay are Immigrants from Colombia (84.4%, a difference of 0.010%), Immigrants from Liberia (84.4%, a difference of 0.030%), Immigrants from Middle Africa (84.4%, a difference of 0.030%), Immigrants from South America (84.4%, a difference of 0.050%), and Immigrants from Panama (84.4%, a difference of 0.060%).
| Demographics | Rating | Rank | GED/Equivalency |
| Iroquois | 7.5 /100 | #222 | Tragic 84.6% |
| Immigrants | Uzbekistan | 7.1 /100 | #223 | Tragic 84.6% |
| French American Indians | 6.3 /100 | #224 | Tragic 84.6% |
| Immigrants | Thailand | 5.8 /100 | #225 | Tragic 84.5% |
| Immigrants | Zaire | 5.5 /100 | #226 | Tragic 84.5% |
| Immigrants | Costa Rica | 5.4 /100 | #227 | Tragic 84.5% |
| Immigrants | Liberia | 4.9 /100 | #228 | Tragic 84.4% |
| Immigrants | Uruguay | 4.6 /100 | #229 | Tragic 84.4% |
| Immigrants | Colombia | 4.5 /100 | #230 | Tragic 84.4% |
| Immigrants | Middle Africa | 4.3 /100 | #231 | Tragic 84.4% |
| Immigrants | South America | 4.2 /100 | #232 | Tragic 84.4% |
| Immigrants | Panama | 4.1 /100 | #233 | Tragic 84.4% |
| Immigrants | Nigeria | 3.6 /100 | #234 | Tragic 84.3% |
| Ghanaians | 3.5 /100 | #235 | Tragic 84.3% |
| Immigrants | Eritrea | 3.5 /100 | #236 | Tragic 84.3% |