Aleut vs Peruvian GED/Equivalency
COMPARE
Aleut
Peruvian
GED/Equivalency
GED/Equivalency Comparison
Aleuts
Peruvians
85.6%
GED/EQUIVALENCY
40.5/ 100
METRIC RATING
179th/ 347
METRIC RANK
84.7%
GED/EQUIVALENCY
9.2/ 100
METRIC RATING
215th/ 347
METRIC RANK
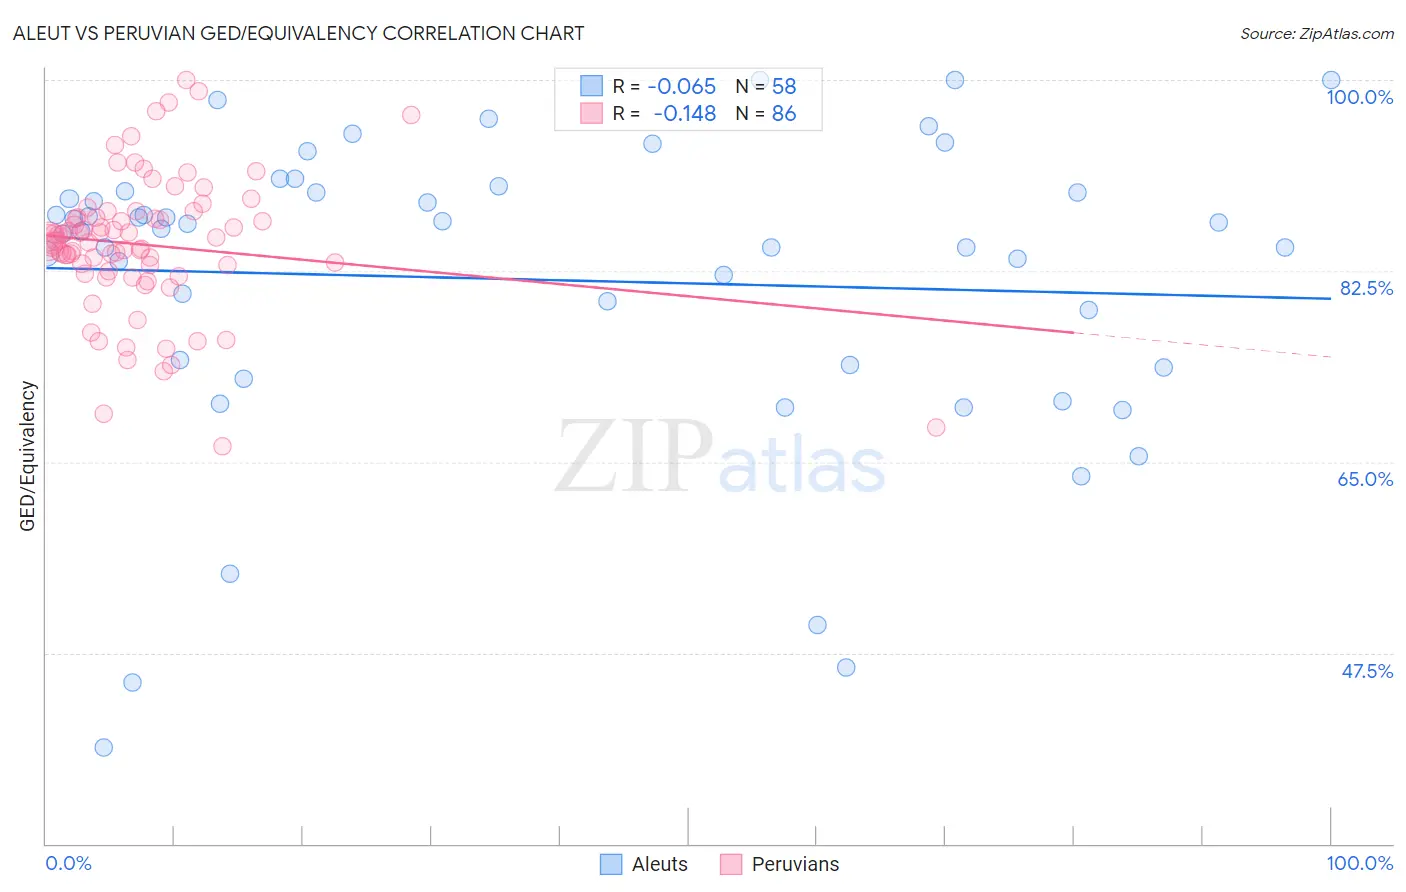
Aleut vs Peruvian GED/Equivalency Correlation Chart
The statistical analysis conducted on geographies consisting of 61,782,940 people shows a slight negative correlation between the proportion of Aleuts and percentage of population with at least ged/equivalency education in the United States with a correlation coefficient (R) of -0.065 and weighted average of 85.6%. Similarly, the statistical analysis conducted on geographies consisting of 363,251,075 people shows a poor negative correlation between the proportion of Peruvians and percentage of population with at least ged/equivalency education in the United States with a correlation coefficient (R) of -0.148 and weighted average of 84.7%, a difference of 0.99%.
GED/Equivalency Correlation Summary
| Measurement | Aleut | Peruvian |
| Minimum | 38.8% | 66.4% |
| Maximum | 100.0% | 100.0% |
| Range | 61.2% | 33.6% |
| Mean | 81.7% | 84.9% |
| Median | 86.3% | 85.2% |
| Interquartile 25% (IQ1) | 73.9% | 82.5% |
| Interquartile 75% (IQ3) | 89.7% | 87.5% |
| Interquartile Range (IQR) | 15.8% | 5.0% |
| Standard Deviation (Sample) | 13.9% | 6.4% |
| Standard Deviation (Population) | 13.8% | 6.3% |
Similar Demographics by GED/Equivalency
Demographics Similar to Aleuts by GED/Equivalency
In terms of ged/equivalency, the demographic groups most similar to Aleuts are Korean (85.6%, a difference of 0.020%), Immigrants from Southern Europe (85.5%, a difference of 0.040%), Moroccan (85.5%, a difference of 0.060%), Immigrants from Uganda (85.7%, a difference of 0.10%), and Sudanese (85.5%, a difference of 0.12%).
| Demographics | Rating | Rank | GED/Equivalency |
| Bermudans | 55.1 /100 | #172 | Average 85.8% |
| Immigrants | Venezuela | 50.7 /100 | #173 | Average 85.8% |
| Ottawa | 50.0 /100 | #174 | Average 85.8% |
| Immigrants | Bolivia | 49.8 /100 | #175 | Average 85.8% |
| Immigrants | Eastern Africa | 47.7 /100 | #176 | Average 85.7% |
| Immigrants | Uganda | 45.2 /100 | #177 | Average 85.7% |
| Koreans | 41.2 /100 | #178 | Average 85.6% |
| Aleuts | 40.5 /100 | #179 | Average 85.6% |
| Immigrants | Southern Europe | 38.4 /100 | #180 | Fair 85.5% |
| Moroccans | 37.7 /100 | #181 | Fair 85.5% |
| Sudanese | 35.2 /100 | #182 | Fair 85.5% |
| Immigrants | Sudan | 34.2 /100 | #183 | Fair 85.5% |
| Immigrants | Oceania | 33.6 /100 | #184 | Fair 85.5% |
| Spanish | 32.8 /100 | #185 | Fair 85.4% |
| Spaniards | 31.9 /100 | #186 | Fair 85.4% |
Demographics Similar to Peruvians by GED/Equivalency
In terms of ged/equivalency, the demographic groups most similar to Peruvians are Osage (84.8%, a difference of 0.020%), Immigrants from Micronesia (84.7%, a difference of 0.030%), Nigerian (84.7%, a difference of 0.030%), Alaska Native (84.7%, a difference of 0.030%), and Immigrants from Philippines (84.8%, a difference of 0.050%).
| Demographics | Rating | Rank | GED/Equivalency |
| Marshallese | 12.5 /100 | #208 | Poor 84.9% |
| Colombians | 12.3 /100 | #209 | Poor 84.9% |
| Immigrants | Cameroon | 12.1 /100 | #210 | Poor 84.9% |
| South Americans | 10.9 /100 | #211 | Poor 84.8% |
| Immigrants | Somalia | 10.6 /100 | #212 | Poor 84.8% |
| Immigrants | Philippines | 10.0 /100 | #213 | Poor 84.8% |
| Osage | 9.5 /100 | #214 | Tragic 84.8% |
| Peruvians | 9.2 /100 | #215 | Tragic 84.7% |
| Immigrants | Micronesia | 8.7 /100 | #216 | Tragic 84.7% |
| Nigerians | 8.6 /100 | #217 | Tragic 84.7% |
| Alaska Natives | 8.6 /100 | #218 | Tragic 84.7% |
| Potawatomi | 8.2 /100 | #219 | Tragic 84.7% |
| Americans | 8.2 /100 | #220 | Tragic 84.7% |
| Taiwanese | 8.1 /100 | #221 | Tragic 84.7% |
| Iroquois | 7.5 /100 | #222 | Tragic 84.6% |