Aleut vs Palestinian GED/Equivalency
COMPARE
Aleut
Palestinian
GED/Equivalency
GED/Equivalency Comparison
Aleuts
Palestinians
85.6%
GED/EQUIVALENCY
40.5/ 100
METRIC RATING
179th/ 347
METRIC RANK
87.3%
GED/EQUIVALENCY
96.8/ 100
METRIC RATING
100th/ 347
METRIC RANK
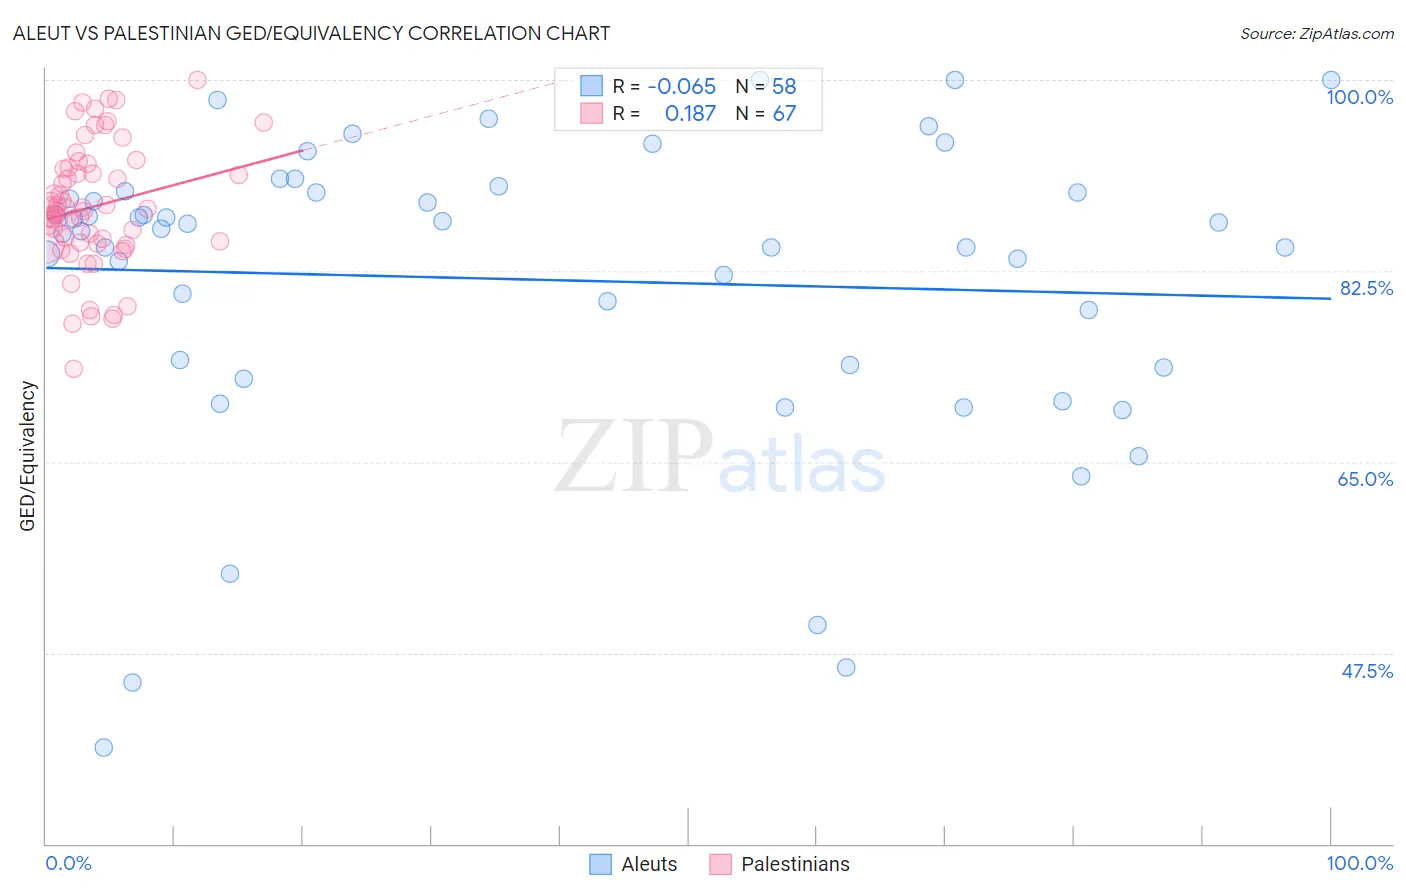
Aleut vs Palestinian GED/Equivalency Correlation Chart
The statistical analysis conducted on geographies consisting of 61,782,940 people shows a slight negative correlation between the proportion of Aleuts and percentage of population with at least ged/equivalency education in the United States with a correlation coefficient (R) of -0.065 and weighted average of 85.6%. Similarly, the statistical analysis conducted on geographies consisting of 216,461,770 people shows a poor positive correlation between the proportion of Palestinians and percentage of population with at least ged/equivalency education in the United States with a correlation coefficient (R) of 0.187 and weighted average of 87.3%, a difference of 1.9%.
GED/Equivalency Correlation Summary
| Measurement | Aleut | Palestinian |
| Minimum | 38.8% | 73.5% |
| Maximum | 100.0% | 100.0% |
| Range | 61.2% | 26.5% |
| Mean | 81.7% | 88.4% |
| Median | 86.3% | 88.2% |
| Interquartile 25% (IQ1) | 73.9% | 85.0% |
| Interquartile 75% (IQ3) | 89.7% | 92.0% |
| Interquartile Range (IQR) | 15.8% | 7.0% |
| Standard Deviation (Sample) | 13.9% | 5.7% |
| Standard Deviation (Population) | 13.8% | 5.6% |
Similar Demographics by GED/Equivalency
Demographics Similar to Aleuts by GED/Equivalency
In terms of ged/equivalency, the demographic groups most similar to Aleuts are Korean (85.6%, a difference of 0.020%), Immigrants from Southern Europe (85.5%, a difference of 0.040%), Moroccan (85.5%, a difference of 0.060%), Immigrants from Uganda (85.7%, a difference of 0.10%), and Sudanese (85.5%, a difference of 0.12%).
| Demographics | Rating | Rank | GED/Equivalency |
| Bermudans | 55.1 /100 | #172 | Average 85.8% |
| Immigrants | Venezuela | 50.7 /100 | #173 | Average 85.8% |
| Ottawa | 50.0 /100 | #174 | Average 85.8% |
| Immigrants | Bolivia | 49.8 /100 | #175 | Average 85.8% |
| Immigrants | Eastern Africa | 47.7 /100 | #176 | Average 85.7% |
| Immigrants | Uganda | 45.2 /100 | #177 | Average 85.7% |
| Koreans | 41.2 /100 | #178 | Average 85.6% |
| Aleuts | 40.5 /100 | #179 | Average 85.6% |
| Immigrants | Southern Europe | 38.4 /100 | #180 | Fair 85.5% |
| Moroccans | 37.7 /100 | #181 | Fair 85.5% |
| Sudanese | 35.2 /100 | #182 | Fair 85.5% |
| Immigrants | Sudan | 34.2 /100 | #183 | Fair 85.5% |
| Immigrants | Oceania | 33.6 /100 | #184 | Fair 85.5% |
| Spanish | 32.8 /100 | #185 | Fair 85.4% |
| Spaniards | 31.9 /100 | #186 | Fair 85.4% |
Demographics Similar to Palestinians by GED/Equivalency
In terms of ged/equivalency, the demographic groups most similar to Palestinians are Immigrants from Belarus (87.3%, a difference of 0.020%), Immigrants from Croatia (87.3%, a difference of 0.030%), Syrian (87.2%, a difference of 0.030%), Immigrants from Western Europe (87.3%, a difference of 0.090%), and Lebanese (87.2%, a difference of 0.090%).
| Demographics | Rating | Rank | GED/Equivalency |
| Immigrants | North Macedonia | 97.8 /100 | #93 | Exceptional 87.4% |
| Immigrants | Russia | 97.8 /100 | #94 | Exceptional 87.4% |
| Immigrants | Greece | 97.7 /100 | #95 | Exceptional 87.4% |
| Czechoslovakians | 97.6 /100 | #96 | Exceptional 87.4% |
| Immigrants | Western Europe | 97.3 /100 | #97 | Exceptional 87.3% |
| Immigrants | Croatia | 96.9 /100 | #98 | Exceptional 87.3% |
| Immigrants | Belarus | 96.9 /100 | #99 | Exceptional 87.3% |
| Palestinians | 96.8 /100 | #100 | Exceptional 87.3% |
| Syrians | 96.6 /100 | #101 | Exceptional 87.2% |
| Lebanese | 96.2 /100 | #102 | Exceptional 87.2% |
| Jordanians | 96.1 /100 | #103 | Exceptional 87.2% |
| Immigrants | Hungary | 96.0 /100 | #104 | Exceptional 87.2% |
| Indians (Asian) | 95.9 /100 | #105 | Exceptional 87.1% |
| Immigrants | Zimbabwe | 95.8 /100 | #106 | Exceptional 87.1% |
| Icelanders | 95.7 /100 | #107 | Exceptional 87.1% |