Navajo vs Immigrants from Cameroon Associate's Degree
COMPARE
Navajo
Immigrants from Cameroon
Associate's Degree
Associate's Degree Comparison
Navajo
Immigrants from Cameroon
32.6%
ASSOCIATE'S DEGREE
0.0/ 100
METRIC RATING
340th/ 347
METRIC RANK
45.7%
ASSOCIATE'S DEGREE
31.0/ 100
METRIC RATING
193rd/ 347
METRIC RANK
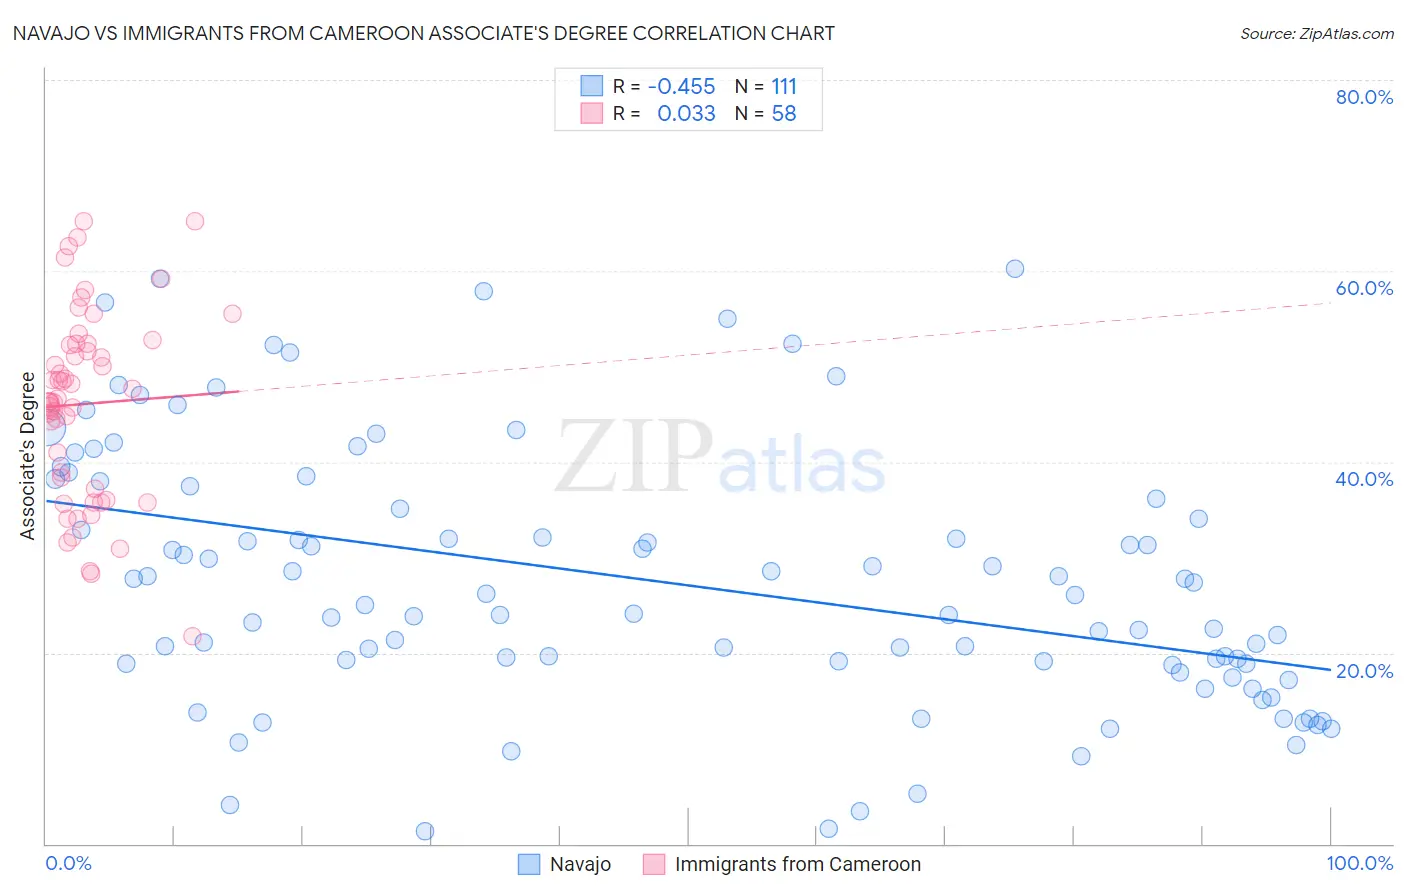
Navajo vs Immigrants from Cameroon Associate's Degree Correlation Chart
The statistical analysis conducted on geographies consisting of 224,870,654 people shows a moderate negative correlation between the proportion of Navajo and percentage of population with at least associate's degree education in the United States with a correlation coefficient (R) of -0.455 and weighted average of 32.6%. Similarly, the statistical analysis conducted on geographies consisting of 130,766,713 people shows no correlation between the proportion of Immigrants from Cameroon and percentage of population with at least associate's degree education in the United States with a correlation coefficient (R) of 0.033 and weighted average of 45.7%, a difference of 40.1%.
Associate's Degree Correlation Summary
| Measurement | Navajo | Immigrants from Cameroon |
| Minimum | 1.3% | 21.7% |
| Maximum | 60.2% | 65.2% |
| Range | 58.9% | 43.4% |
| Mean | 27.4% | 46.1% |
| Median | 25.1% | 46.5% |
| Interquartile 25% (IQ1) | 18.8% | 37.1% |
| Interquartile 75% (IQ3) | 36.2% | 52.3% |
| Interquartile Range (IQR) | 17.4% | 15.2% |
| Standard Deviation (Sample) | 13.5% | 10.0% |
| Standard Deviation (Population) | 13.4% | 9.9% |
Similar Demographics by Associate's Degree
Demographics Similar to Navajo by Associate's Degree
In terms of associate's degree, the demographic groups most similar to Navajo are Inupiat (32.6%, a difference of 0.050%), Yakama (32.3%, a difference of 0.83%), Tohono O'odham (31.8%, a difference of 2.5%), Immigrants from Mexico (33.7%, a difference of 3.5%), and Pueblo (34.0%, a difference of 4.3%).
| Demographics | Rating | Rank | Associate's Degree |
| Mexicans | 0.0 /100 | #333 | Tragic 35.0% |
| Natives/Alaskans | 0.0 /100 | #334 | Tragic 34.9% |
| Spanish American Indians | 0.0 /100 | #335 | Tragic 34.9% |
| Hopi | 0.0 /100 | #336 | Tragic 34.6% |
| Lumbee | 0.0 /100 | #337 | Tragic 34.1% |
| Pueblo | 0.0 /100 | #338 | Tragic 34.0% |
| Immigrants | Mexico | 0.0 /100 | #339 | Tragic 33.7% |
| Navajo | 0.0 /100 | #340 | Tragic 32.6% |
| Inupiat | 0.0 /100 | #341 | Tragic 32.6% |
| Yakama | 0.0 /100 | #342 | Tragic 32.3% |
| Tohono O'odham | 0.0 /100 | #343 | Tragic 31.8% |
| Yuman | 0.0 /100 | #344 | Tragic 31.3% |
| Pima | 0.0 /100 | #345 | Tragic 30.2% |
| Houma | 0.0 /100 | #346 | Tragic 28.2% |
| Yup'ik | 0.0 /100 | #347 | Tragic 25.0% |
Demographics Similar to Immigrants from Cameroon by Associate's Degree
In terms of associate's degree, the demographic groups most similar to Immigrants from Cameroon are Celtic (45.8%, a difference of 0.20%), Korean (45.8%, a difference of 0.24%), Vietnamese (45.8%, a difference of 0.26%), Immigrants from Oceania (45.8%, a difference of 0.32%), and Immigrants from Peru (45.5%, a difference of 0.32%).
| Demographics | Rating | Rank | Associate's Degree |
| Welsh | 37.9 /100 | #186 | Fair 45.9% |
| Immigrants | Uruguay | 35.5 /100 | #187 | Fair 45.8% |
| Ghanaians | 35.5 /100 | #188 | Fair 45.8% |
| Immigrants | Oceania | 34.7 /100 | #189 | Fair 45.8% |
| Vietnamese | 34.0 /100 | #190 | Fair 45.8% |
| Koreans | 33.8 /100 | #191 | Fair 45.8% |
| Celtics | 33.3 /100 | #192 | Fair 45.8% |
| Immigrants | Cameroon | 31.0 /100 | #193 | Fair 45.7% |
| Immigrants | Peru | 27.6 /100 | #194 | Fair 45.5% |
| Germans | 26.5 /100 | #195 | Fair 45.5% |
| French | 25.6 /100 | #196 | Fair 45.4% |
| Scotch-Irish | 22.3 /100 | #197 | Fair 45.3% |
| Immigrants | Bangladesh | 21.3 /100 | #198 | Fair 45.2% |
| Immigrants | Senegal | 21.2 /100 | #199 | Fair 45.2% |
| Senegalese | 21.1 /100 | #200 | Fair 45.2% |