Soviet Union vs Immigrants from Cameroon Associate's Degree
COMPARE
Soviet Union
Immigrants from Cameroon
Associate's Degree
Associate's Degree Comparison
Soviet Union
Immigrants from Cameroon
55.1%
ASSOCIATE'S DEGREE
100.0/ 100
METRIC RATING
16th/ 347
METRIC RANK
45.7%
ASSOCIATE'S DEGREE
31.0/ 100
METRIC RATING
193rd/ 347
METRIC RANK
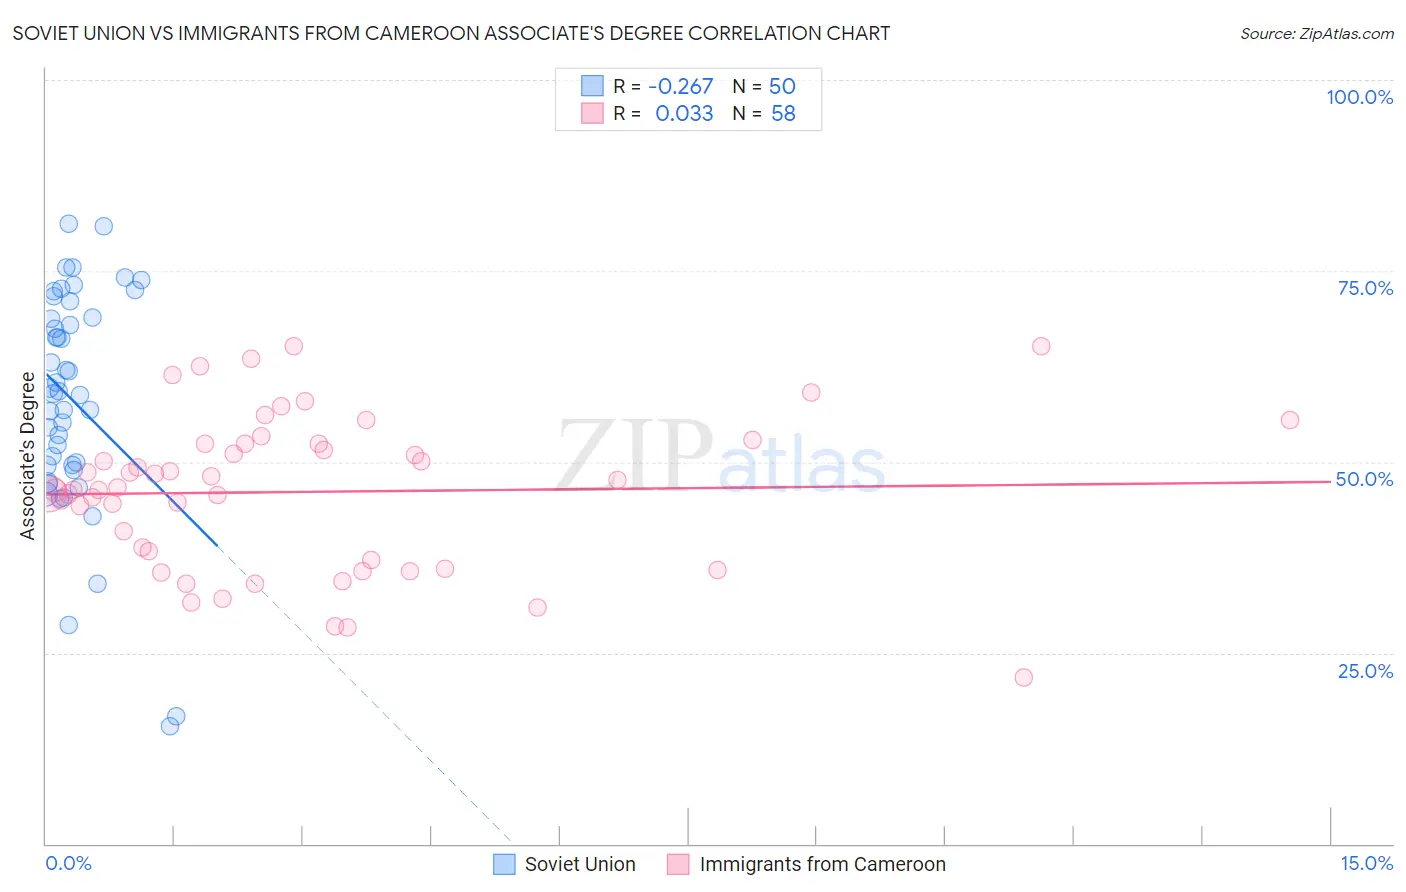
Soviet Union vs Immigrants from Cameroon Associate's Degree Correlation Chart
The statistical analysis conducted on geographies consisting of 43,514,626 people shows a weak negative correlation between the proportion of Soviet Union and percentage of population with at least associate's degree education in the United States with a correlation coefficient (R) of -0.267 and weighted average of 55.1%. Similarly, the statistical analysis conducted on geographies consisting of 130,766,713 people shows no correlation between the proportion of Immigrants from Cameroon and percentage of population with at least associate's degree education in the United States with a correlation coefficient (R) of 0.033 and weighted average of 45.7%, a difference of 20.7%.
Associate's Degree Correlation Summary
| Measurement | Soviet Union | Immigrants from Cameroon |
| Minimum | 15.5% | 21.7% |
| Maximum | 81.2% | 65.2% |
| Range | 65.7% | 43.4% |
| Mean | 58.0% | 46.1% |
| Median | 59.1% | 46.5% |
| Interquartile 25% (IQ1) | 49.5% | 37.1% |
| Interquartile 75% (IQ3) | 68.9% | 52.3% |
| Interquartile Range (IQR) | 19.4% | 15.2% |
| Standard Deviation (Sample) | 14.7% | 10.0% |
| Standard Deviation (Population) | 14.5% | 9.9% |
Similar Demographics by Associate's Degree
Demographics Similar to Soviet Union by Associate's Degree
In terms of associate's degree, the demographic groups most similar to Soviet Union are Eastern European (55.0%, a difference of 0.14%), Immigrants from Eastern Asia (55.4%, a difference of 0.47%), Immigrants from Hong Kong (55.4%, a difference of 0.50%), Indian (Asian) (54.8%, a difference of 0.61%), and Immigrants from China (55.5%, a difference of 0.65%).
| Demographics | Rating | Rank | Associate's Degree |
| Immigrants | Israel | 100.0 /100 | #9 | Exceptional 56.8% |
| Cypriots | 100.0 /100 | #10 | Exceptional 56.4% |
| Immigrants | Australia | 100.0 /100 | #11 | Exceptional 55.8% |
| Immigrants | South Central Asia | 100.0 /100 | #12 | Exceptional 55.7% |
| Immigrants | China | 100.0 /100 | #13 | Exceptional 55.5% |
| Immigrants | Hong Kong | 100.0 /100 | #14 | Exceptional 55.4% |
| Immigrants | Eastern Asia | 100.0 /100 | #15 | Exceptional 55.4% |
| Soviet Union | 100.0 /100 | #16 | Exceptional 55.1% |
| Eastern Europeans | 100.0 /100 | #17 | Exceptional 55.0% |
| Indians (Asian) | 100.0 /100 | #18 | Exceptional 54.8% |
| Immigrants | Ireland | 100.0 /100 | #19 | Exceptional 54.7% |
| Cambodians | 100.0 /100 | #20 | Exceptional 54.6% |
| Immigrants | Sweden | 100.0 /100 | #21 | Exceptional 54.6% |
| Immigrants | Japan | 100.0 /100 | #22 | Exceptional 54.6% |
| Burmese | 100.0 /100 | #23 | Exceptional 54.6% |
Demographics Similar to Immigrants from Cameroon by Associate's Degree
In terms of associate's degree, the demographic groups most similar to Immigrants from Cameroon are Celtic (45.8%, a difference of 0.20%), Korean (45.8%, a difference of 0.24%), Vietnamese (45.8%, a difference of 0.26%), Immigrants from Oceania (45.8%, a difference of 0.32%), and Immigrants from Peru (45.5%, a difference of 0.32%).
| Demographics | Rating | Rank | Associate's Degree |
| Welsh | 37.9 /100 | #186 | Fair 45.9% |
| Immigrants | Uruguay | 35.5 /100 | #187 | Fair 45.8% |
| Ghanaians | 35.5 /100 | #188 | Fair 45.8% |
| Immigrants | Oceania | 34.7 /100 | #189 | Fair 45.8% |
| Vietnamese | 34.0 /100 | #190 | Fair 45.8% |
| Koreans | 33.8 /100 | #191 | Fair 45.8% |
| Celtics | 33.3 /100 | #192 | Fair 45.8% |
| Immigrants | Cameroon | 31.0 /100 | #193 | Fair 45.7% |
| Immigrants | Peru | 27.6 /100 | #194 | Fair 45.5% |
| Germans | 26.5 /100 | #195 | Fair 45.5% |
| French | 25.6 /100 | #196 | Fair 45.4% |
| Scotch-Irish | 22.3 /100 | #197 | Fair 45.3% |
| Immigrants | Bangladesh | 21.3 /100 | #198 | Fair 45.2% |
| Immigrants | Senegal | 21.2 /100 | #199 | Fair 45.2% |
| Senegalese | 21.1 /100 | #200 | Fair 45.2% |