Immigrants from Ireland vs Jordanian College, Under 1 year
COMPARE
Immigrants from Ireland
Jordanian
College, Under 1 year
College, Under 1 year Comparison
Immigrants from Ireland
Jordanians
71.0%
COLLEGE, UNDER 1 YEAR
100.0/ 100
METRIC RATING
27th/ 347
METRIC RANK
68.0%
COLLEGE, UNDER 1 YEAR
97.4/ 100
METRIC RATING
96th/ 347
METRIC RANK
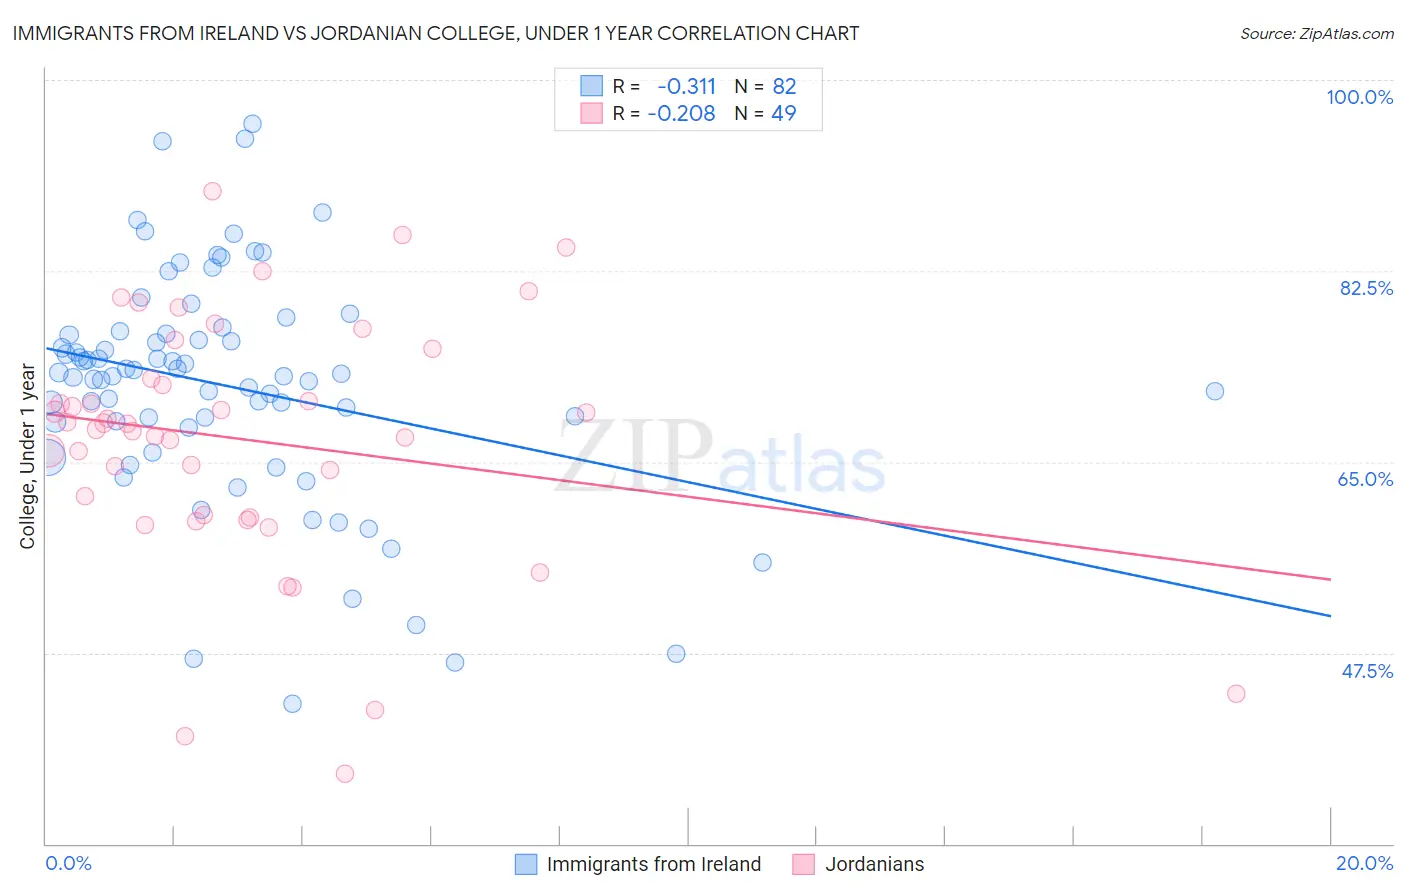
Immigrants from Ireland vs Jordanian College, Under 1 year Correlation Chart
The statistical analysis conducted on geographies consisting of 240,784,591 people shows a mild negative correlation between the proportion of Immigrants from Ireland and percentage of population with at least college, under 1 year education in the United States with a correlation coefficient (R) of -0.311 and weighted average of 71.0%. Similarly, the statistical analysis conducted on geographies consisting of 166,424,117 people shows a weak negative correlation between the proportion of Jordanians and percentage of population with at least college, under 1 year education in the United States with a correlation coefficient (R) of -0.208 and weighted average of 68.0%, a difference of 4.4%.
College, Under 1 year Correlation Summary
| Measurement | Immigrants from Ireland | Jordanian |
| Minimum | 42.8% | 36.4% |
| Maximum | 96.0% | 89.8% |
| Range | 53.2% | 53.4% |
| Mean | 72.0% | 67.0% |
| Median | 73.0% | 68.5% |
| Interquartile 25% (IQ1) | 68.7% | 60.0% |
| Interquartile 75% (IQ3) | 76.8% | 74.0% |
| Interquartile Range (IQR) | 8.1% | 14.0% |
| Standard Deviation (Sample) | 10.6% | 11.5% |
| Standard Deviation (Population) | 10.5% | 11.3% |
Similar Demographics by College, Under 1 year
Demographics Similar to Immigrants from Ireland by College, Under 1 year
In terms of college, under 1 year, the demographic groups most similar to Immigrants from Ireland are Immigrants from Denmark (71.0%, a difference of 0.010%), Immigrants from Hong Kong (71.0%, a difference of 0.030%), Immigrants from France (71.0%, a difference of 0.030%), Bulgarian (71.1%, a difference of 0.13%), and Soviet Union (71.1%, a difference of 0.14%).
| Demographics | Rating | Rank | College, Under 1 year |
| Immigrants | Korea | 100.0 /100 | #20 | Exceptional 71.6% |
| Immigrants | Belgium | 100.0 /100 | #21 | Exceptional 71.5% |
| Immigrants | Eastern Asia | 100.0 /100 | #22 | Exceptional 71.3% |
| Immigrants | Northern Europe | 100.0 /100 | #23 | Exceptional 71.1% |
| Soviet Union | 100.0 /100 | #24 | Exceptional 71.1% |
| Bulgarians | 100.0 /100 | #25 | Exceptional 71.1% |
| Immigrants | Denmark | 100.0 /100 | #26 | Exceptional 71.0% |
| Immigrants | Ireland | 100.0 /100 | #27 | Exceptional 71.0% |
| Immigrants | Hong Kong | 100.0 /100 | #28 | Exceptional 71.0% |
| Immigrants | France | 100.0 /100 | #29 | Exceptional 71.0% |
| Immigrants | China | 99.9 /100 | #30 | Exceptional 70.9% |
| Indians (Asian) | 99.9 /100 | #31 | Exceptional 70.8% |
| Turks | 99.9 /100 | #32 | Exceptional 70.7% |
| Immigrants | South Africa | 99.9 /100 | #33 | Exceptional 70.6% |
| Estonians | 99.9 /100 | #34 | Exceptional 70.6% |
Demographics Similar to Jordanians by College, Under 1 year
In terms of college, under 1 year, the demographic groups most similar to Jordanians are Immigrants from Pakistan (68.0%, a difference of 0.030%), Immigrants from Ethiopia (68.0%, a difference of 0.030%), Armenian (68.1%, a difference of 0.13%), Paraguayan (67.9%, a difference of 0.13%), and Immigrants from Bolivia (67.9%, a difference of 0.15%).
| Demographics | Rating | Rank | College, Under 1 year |
| Ethiopians | 98.2 /100 | #89 | Exceptional 68.3% |
| Icelanders | 98.1 /100 | #90 | Exceptional 68.3% |
| Europeans | 98.1 /100 | #91 | Exceptional 68.2% |
| Luxembourgers | 98.1 /100 | #92 | Exceptional 68.2% |
| Romanians | 97.9 /100 | #93 | Exceptional 68.2% |
| Armenians | 97.7 /100 | #94 | Exceptional 68.1% |
| Immigrants | Pakistan | 97.5 /100 | #95 | Exceptional 68.0% |
| Jordanians | 97.4 /100 | #96 | Exceptional 68.0% |
| Immigrants | Ethiopia | 97.3 /100 | #97 | Exceptional 68.0% |
| Paraguayans | 97.1 /100 | #98 | Exceptional 67.9% |
| Immigrants | Bolivia | 97.0 /100 | #99 | Exceptional 67.9% |
| Immigrants | Argentina | 97.0 /100 | #100 | Exceptional 67.9% |
| Immigrants | Eastern Europe | 96.9 /100 | #101 | Exceptional 67.9% |
| Palestinians | 96.9 /100 | #102 | Exceptional 67.9% |
| Carpatho Rusyns | 96.8 /100 | #103 | Exceptional 67.9% |