Palestinian vs Yugoslavian Master's Degree
COMPARE
Palestinian
Yugoslavian
Master's Degree
Master's Degree Comparison
Palestinians
Yugoslavians
16.3%
MASTER'S DEGREE
94.8/ 100
METRIC RATING
127th/ 347
METRIC RANK
14.4%
MASTER'S DEGREE
24.3/ 100
METRIC RATING
203rd/ 347
METRIC RANK
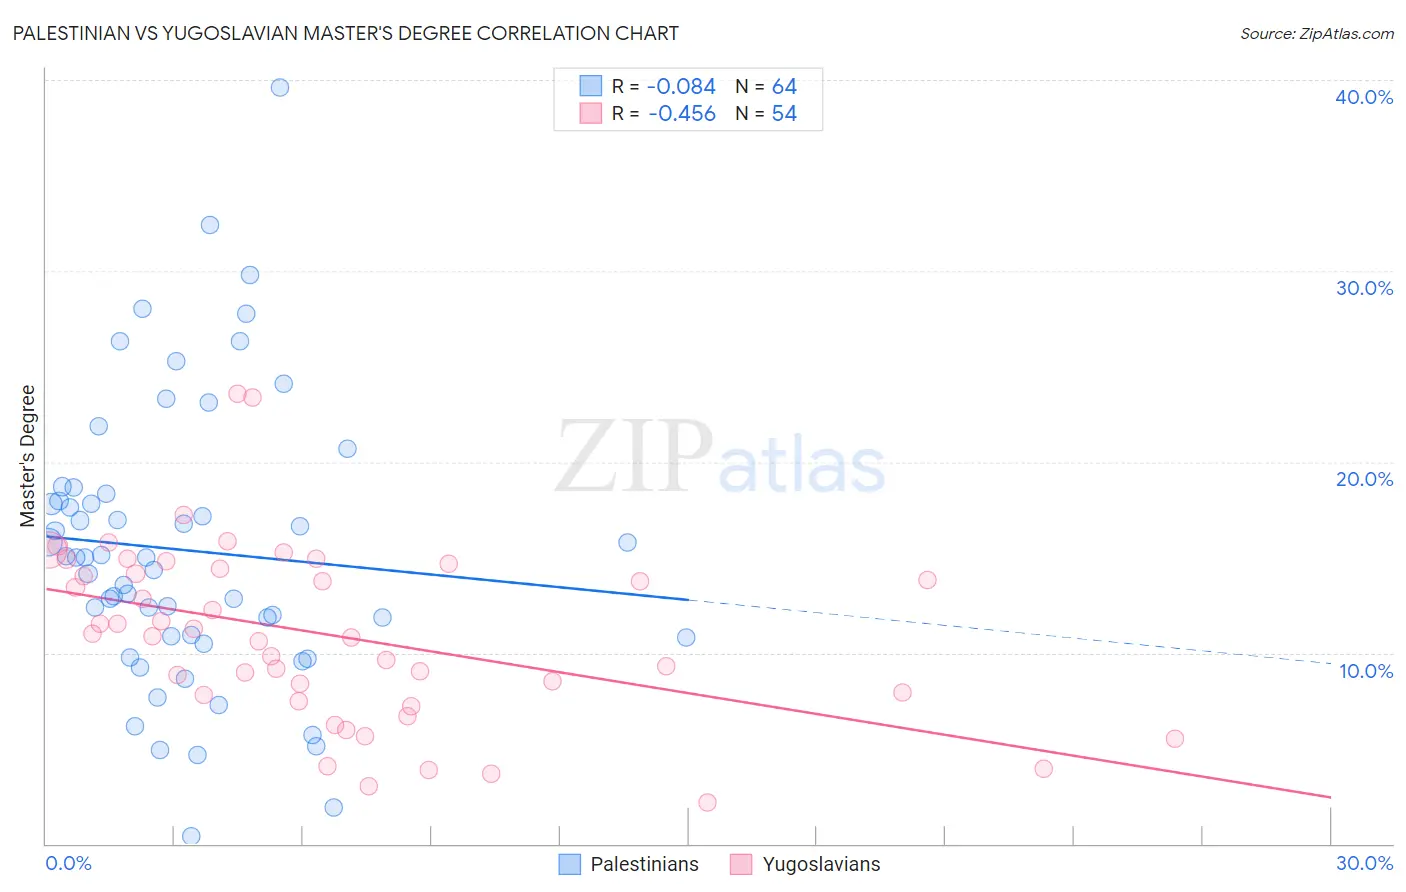
Palestinian vs Yugoslavian Master's Degree Correlation Chart
The statistical analysis conducted on geographies consisting of 216,432,261 people shows a slight negative correlation between the proportion of Palestinians and percentage of population with at least master's degree education in the United States with a correlation coefficient (R) of -0.084 and weighted average of 16.3%. Similarly, the statistical analysis conducted on geographies consisting of 285,661,106 people shows a moderate negative correlation between the proportion of Yugoslavians and percentage of population with at least master's degree education in the United States with a correlation coefficient (R) of -0.456 and weighted average of 14.4%, a difference of 13.4%.
Master's Degree Correlation Summary
| Measurement | Palestinian | Yugoslavian |
| Minimum | 0.42% | 2.2% |
| Maximum | 39.6% | 23.6% |
| Range | 39.2% | 21.4% |
| Mean | 15.4% | 10.9% |
| Median | 15.0% | 10.9% |
| Interquartile 25% (IQ1) | 10.8% | 7.8% |
| Interquartile 75% (IQ3) | 18.1% | 14.4% |
| Interquartile Range (IQR) | 7.3% | 6.6% |
| Standard Deviation (Sample) | 7.4% | 4.7% |
| Standard Deviation (Population) | 7.4% | 4.6% |
Similar Demographics by Master's Degree
Demographics Similar to Palestinians by Master's Degree
In terms of master's degree, the demographic groups most similar to Palestinians are Immigrants from Sierra Leone (16.3%, a difference of 0.050%), Immigrants from Eastern Africa (16.3%, a difference of 0.26%), Italian (16.4%, a difference of 0.37%), Immigrants from Eritrea (16.4%, a difference of 0.45%), and Croatian (16.4%, a difference of 0.52%).
| Demographics | Rating | Rank | Master's Degree |
| Lebanese | 96.4 /100 | #120 | Exceptional 16.5% |
| Afghans | 96.2 /100 | #121 | Exceptional 16.5% |
| British | 95.6 /100 | #122 | Exceptional 16.4% |
| Croatians | 95.6 /100 | #123 | Exceptional 16.4% |
| Immigrants | Eritrea | 95.5 /100 | #124 | Exceptional 16.4% |
| Italians | 95.4 /100 | #125 | Exceptional 16.4% |
| Immigrants | Eastern Africa | 95.2 /100 | #126 | Exceptional 16.3% |
| Palestinians | 94.8 /100 | #127 | Exceptional 16.3% |
| Immigrants | Sierra Leone | 94.7 /100 | #128 | Exceptional 16.3% |
| Immigrants | Syria | 93.3 /100 | #129 | Exceptional 16.2% |
| Immigrants | Jordan | 92.7 /100 | #130 | Exceptional 16.1% |
| Taiwanese | 91.9 /100 | #131 | Exceptional 16.1% |
| Serbians | 91.7 /100 | #132 | Exceptional 16.1% |
| Immigrants | Sudan | 90.2 /100 | #133 | Exceptional 16.0% |
| Venezuelans | 88.4 /100 | #134 | Excellent 15.9% |
Demographics Similar to Yugoslavians by Master's Degree
In terms of master's degree, the demographic groups most similar to Yugoslavians are Immigrants from Western Africa (14.4%, a difference of 0.11%), French (14.4%, a difference of 0.11%), Panamanian (14.4%, a difference of 0.13%), Scotch-Irish (14.4%, a difference of 0.13%), and Trinidadian and Tobagonian (14.4%, a difference of 0.15%).
| Demographics | Rating | Rank | Master's Degree |
| Czechoslovakians | 29.9 /100 | #196 | Fair 14.5% |
| Belgians | 28.0 /100 | #197 | Fair 14.5% |
| West Indians | 27.4 /100 | #198 | Fair 14.5% |
| Immigrants | Armenia | 27.2 /100 | #199 | Fair 14.5% |
| Panamanians | 25.1 /100 | #200 | Fair 14.4% |
| Scotch-Irish | 25.0 /100 | #201 | Fair 14.4% |
| Immigrants | Western Africa | 24.9 /100 | #202 | Fair 14.4% |
| Yugoslavians | 24.3 /100 | #203 | Fair 14.4% |
| French | 23.7 /100 | #204 | Fair 14.4% |
| Trinidadians and Tobagonians | 23.5 /100 | #205 | Fair 14.4% |
| Scandinavians | 23.3 /100 | #206 | Fair 14.4% |
| Immigrants | Bosnia and Herzegovina | 22.0 /100 | #207 | Fair 14.3% |
| Immigrants | Barbados | 20.5 /100 | #208 | Fair 14.3% |
| Immigrants | Panama | 20.0 /100 | #209 | Fair 14.3% |
| Sub-Saharan Africans | 19.4 /100 | #210 | Poor 14.2% |