Osage vs Yugoslavian Master's Degree
COMPARE
Osage
Yugoslavian
Master's Degree
Master's Degree Comparison
Osage
Yugoslavians
12.6%
MASTER'S DEGREE
0.7/ 100
METRIC RATING
257th/ 347
METRIC RANK
14.4%
MASTER'S DEGREE
24.3/ 100
METRIC RATING
203rd/ 347
METRIC RANK
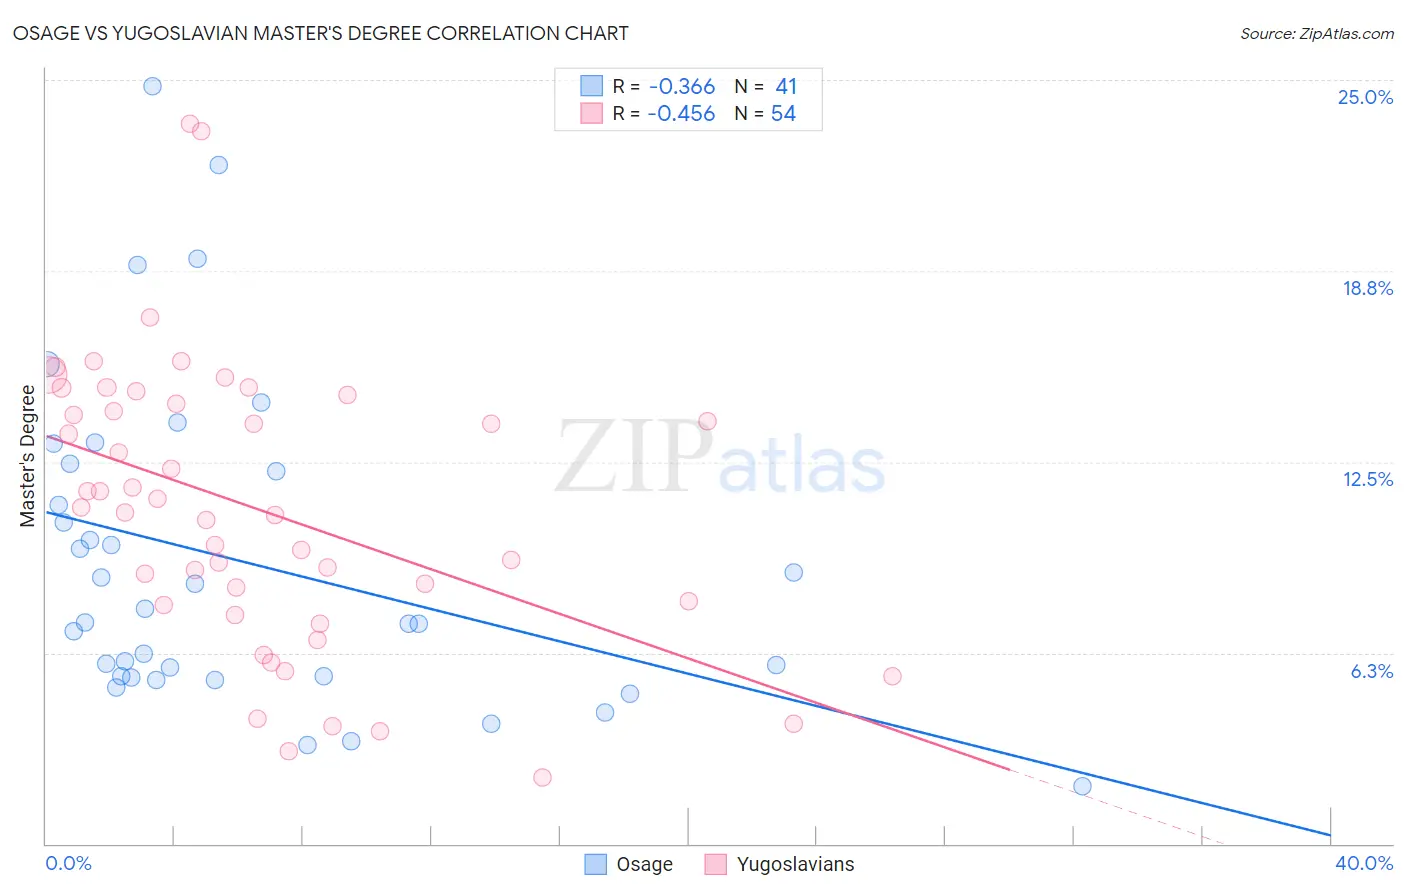
Osage vs Yugoslavian Master's Degree Correlation Chart
The statistical analysis conducted on geographies consisting of 91,790,824 people shows a mild negative correlation between the proportion of Osage and percentage of population with at least master's degree education in the United States with a correlation coefficient (R) of -0.366 and weighted average of 12.6%. Similarly, the statistical analysis conducted on geographies consisting of 285,661,106 people shows a moderate negative correlation between the proportion of Yugoslavians and percentage of population with at least master's degree education in the United States with a correlation coefficient (R) of -0.456 and weighted average of 14.4%, a difference of 14.4%.
Master's Degree Correlation Summary
| Measurement | Osage | Yugoslavian |
| Minimum | 1.9% | 2.2% |
| Maximum | 24.8% | 23.6% |
| Range | 22.9% | 21.4% |
| Mean | 9.2% | 10.9% |
| Median | 7.2% | 10.9% |
| Interquartile 25% (IQ1) | 5.5% | 7.8% |
| Interquartile 75% (IQ3) | 12.3% | 14.4% |
| Interquartile Range (IQR) | 6.9% | 6.6% |
| Standard Deviation (Sample) | 5.3% | 4.7% |
| Standard Deviation (Population) | 5.2% | 4.6% |
Similar Demographics by Master's Degree
Demographics Similar to Osage by Master's Degree
In terms of master's degree, the demographic groups most similar to Osage are Immigrants from Portugal (12.6%, a difference of 0.48%), Immigrants from Liberia (12.5%, a difference of 0.50%), Immigrants from Congo (12.6%, a difference of 0.55%), Indonesian (12.6%, a difference of 0.58%), and Japanese (12.5%, a difference of 0.59%).
| Demographics | Rating | Rank | Master's Degree |
| Liberians | 1.3 /100 | #250 | Tragic 12.8% |
| Tlingit-Haida | 1.3 /100 | #251 | Tragic 12.8% |
| French American Indians | 1.0 /100 | #252 | Tragic 12.7% |
| Immigrants | Dominica | 0.8 /100 | #253 | Tragic 12.6% |
| Indonesians | 0.8 /100 | #254 | Tragic 12.6% |
| Immigrants | Congo | 0.8 /100 | #255 | Tragic 12.6% |
| Immigrants | Portugal | 0.8 /100 | #256 | Tragic 12.6% |
| Osage | 0.7 /100 | #257 | Tragic 12.6% |
| Immigrants | Liberia | 0.6 /100 | #258 | Tragic 12.5% |
| Japanese | 0.6 /100 | #259 | Tragic 12.5% |
| Dominicans | 0.6 /100 | #260 | Tragic 12.5% |
| Tongans | 0.6 /100 | #261 | Tragic 12.5% |
| Nicaraguans | 0.6 /100 | #262 | Tragic 12.5% |
| Central American Indians | 0.5 /100 | #263 | Tragic 12.4% |
| Belizeans | 0.5 /100 | #264 | Tragic 12.4% |
Demographics Similar to Yugoslavians by Master's Degree
In terms of master's degree, the demographic groups most similar to Yugoslavians are Immigrants from Western Africa (14.4%, a difference of 0.11%), French (14.4%, a difference of 0.11%), Panamanian (14.4%, a difference of 0.13%), Scotch-Irish (14.4%, a difference of 0.13%), and Trinidadian and Tobagonian (14.4%, a difference of 0.15%).
| Demographics | Rating | Rank | Master's Degree |
| Czechoslovakians | 29.9 /100 | #196 | Fair 14.5% |
| Belgians | 28.0 /100 | #197 | Fair 14.5% |
| West Indians | 27.4 /100 | #198 | Fair 14.5% |
| Immigrants | Armenia | 27.2 /100 | #199 | Fair 14.5% |
| Panamanians | 25.1 /100 | #200 | Fair 14.4% |
| Scotch-Irish | 25.0 /100 | #201 | Fair 14.4% |
| Immigrants | Western Africa | 24.9 /100 | #202 | Fair 14.4% |
| Yugoslavians | 24.3 /100 | #203 | Fair 14.4% |
| French | 23.7 /100 | #204 | Fair 14.4% |
| Trinidadians and Tobagonians | 23.5 /100 | #205 | Fair 14.4% |
| Scandinavians | 23.3 /100 | #206 | Fair 14.4% |
| Immigrants | Bosnia and Herzegovina | 22.0 /100 | #207 | Fair 14.3% |
| Immigrants | Barbados | 20.5 /100 | #208 | Fair 14.3% |
| Immigrants | Panama | 20.0 /100 | #209 | Fair 14.3% |
| Sub-Saharan Africans | 19.4 /100 | #210 | Poor 14.2% |